A few followers have asked for additional data confirming our estimations of the DNA contamination because ‘This is a pretty serious claim’. We agree. It is hard to believe it is this bad as natural transcription rates with T7 would never be this stunted. It certainly made us pause and perform multiple check on this. To summarize, we have
Sequenced 4 vaccine vials with two different methods (RNA-Seq and RNase-Seq)
Transformed E.coli
Run gels on Agilent DNA and RNA Tape Stations
qPCR
We have been careful to not state the linear vs circular DNA ratio as we don’t believe any one method perfectly addresses this, yet. The total amount of DNA versus RNA could be complemented with additional data. One reader suggested we run Ethidium Bromide gels. This reader wasn’t familiar with Agilent Tape stations to know that this is a redundant request. Agilent Tape Stations also use gel electrophoresis with intercalating dyes. While this approach won’t offer a new insight, it stems from a valid concern. These are modified RNAs and we really don’t know how they migrate in gels as the N1-methylpseudoU will alter the mass to charge ratio of DNA or RNA and the bands will migrate differently than the standard ladders. Likewise many intercalating dyes like SYBR green I or Ethidium bromide (EtBr) may preferentially bind DNA over RNA resulting in misleading estimates of concentration from gel electrophoresis. SYBR Green I has a 10:1 preference for dsDNA (20pg sensitivity) over ssRNA (200pg sensitivity). SYBR green II is often used for RNA and the Agilent Tape stations in use in this study use these different dyes for staining DNA vs RNA.
Much of this differentiation is based on double strandedness versus single strandedness and N1-methylpseudouridine tends to fold RNA into double stranded structures. So there is fair reason to question our Tape station SYBR green or EtBR quantification.
An alternative approach is to use RNases (Enzymes that eat RNA) and DNases (Enzymes that eat DNA) as these enzymes are far more specific to each type of nucleic acid. If you couple this with qPCR, you can ascertain how much the qPCR signals change after each digestions. This will give you relative amounts of each nucleic acid.
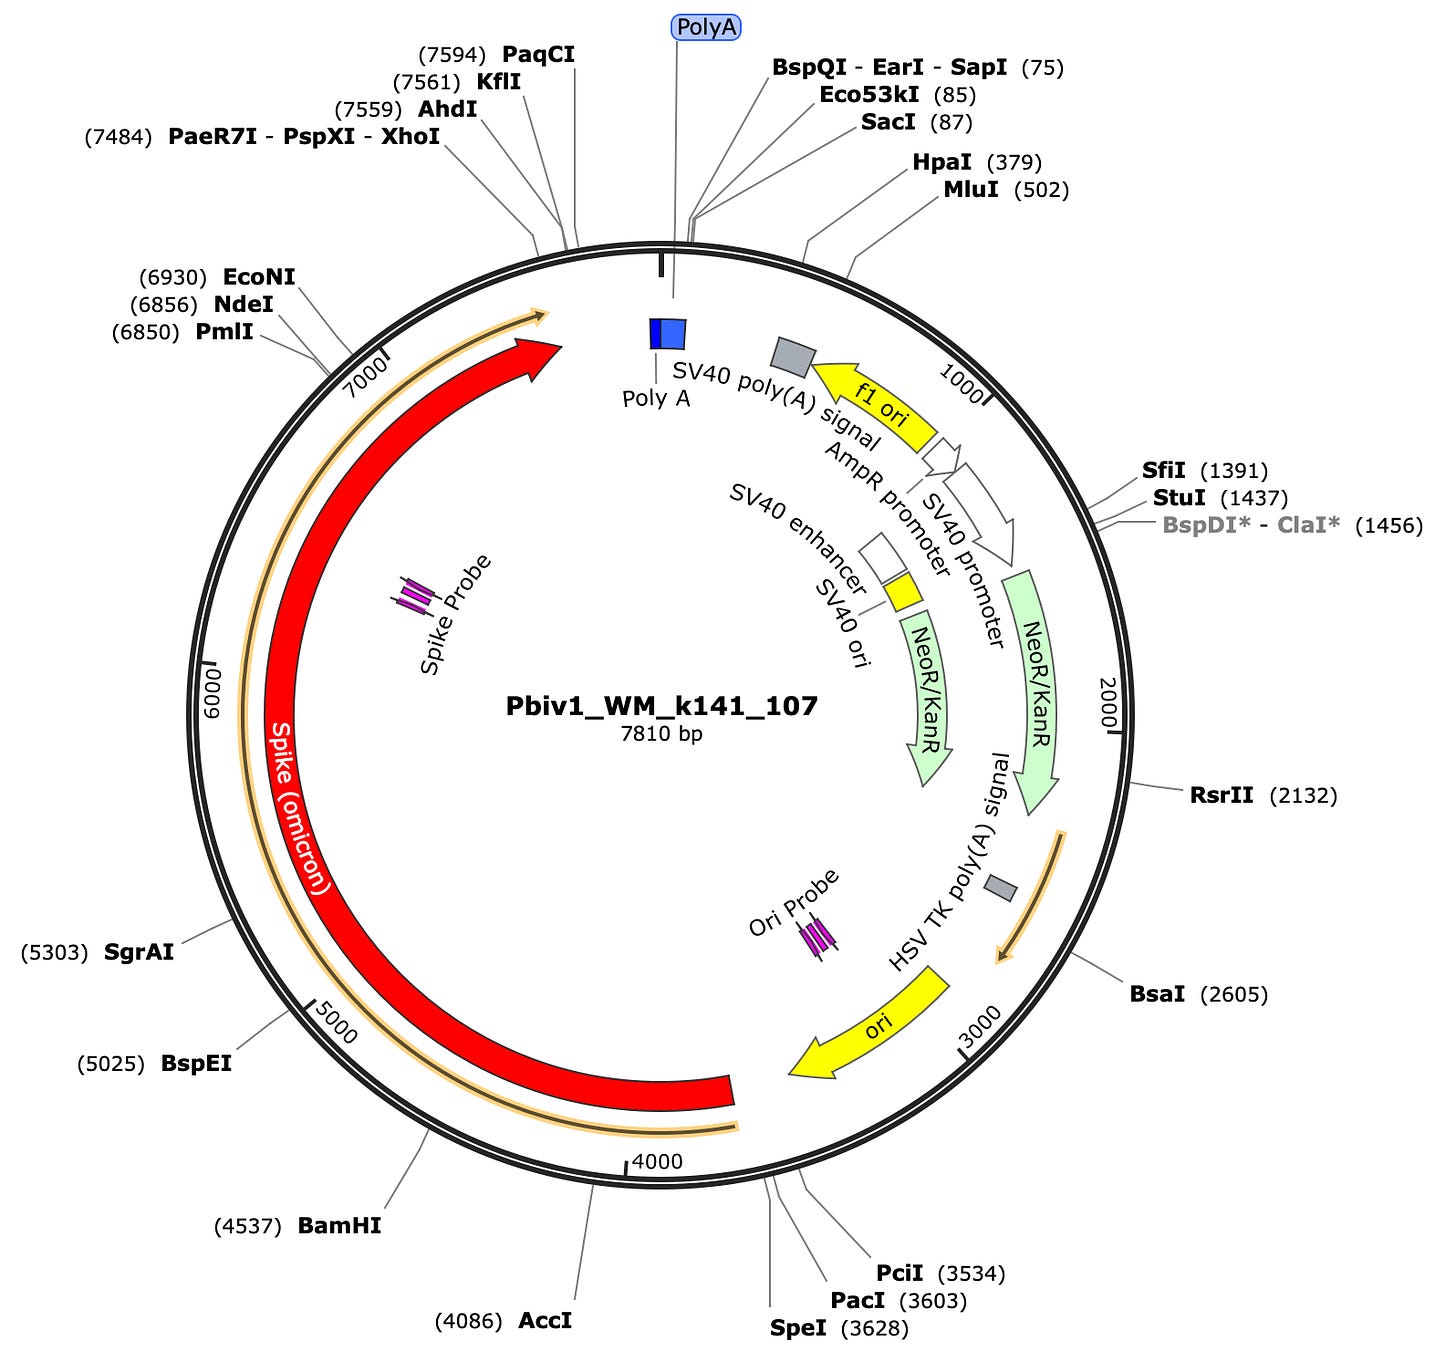
First you need to design qPCR assays that target the Spike Protein in one wavelength. FAM is a dye that absorbs at 495nm and stokes shifts or emits at 520nm. We designed a Spike assay as depicted in the vector map below at 10:00. In addition to this, we designed a qPCR assay in another wavelength that targets the origin of replication that is unique to the plasmid DNA and not the RNA. This assay we place in the HEX channel. This dye absorbs at 535nm and emits at 556nm. Now we have 2 PCR assays that both fluoresce in unique wavelengths so we can run them in the same well (multiplexed) and monitor the course of fluorescence across each cycle of PCR for the vector versus the spike sequence.
There is a finer qPCR detail here.
In qPCR, each dye is linked to a probe that contains a Quencher that prevents these dyes from emitting unless the dye is liberated from the probe. That liberation (technically called probe hydrolysis) occurs when Taq polymerase extends into a probe and exerts and endonuclease activity on anything in its path. Think of a cattle guard on a train and the train is the polymerase copying the tracks. If probe sits on the tracks, it gets cleaved and induces signal. So these probes don’t fluorescence until PCR is replicating DNA or RNA and they do this in a sequence specific manner so you only get signal when your primers are amplifying a sequence that contains the internal probe sequence. This is the preferred method for clinical PCR as that 3rd piece of sequence improves your likelihood of signal from on target amplification. This is mostly true under 35 cycles.
As you can imagine, one can also put SYBR green in the qPCR instead of a probe but then you lose the 3rd sequence confirmation of the probe sequence in Taqman assays and you are stuck with single color PCR.
To recap the tools we have at hand
1)DNases that degrade DNA not RNA
2)RNases that degrade RNA not DNA
3)qPCR that amplifies DNA not RNA
4)RT-PCR that amplifies BOTH DNA and RNA
Results
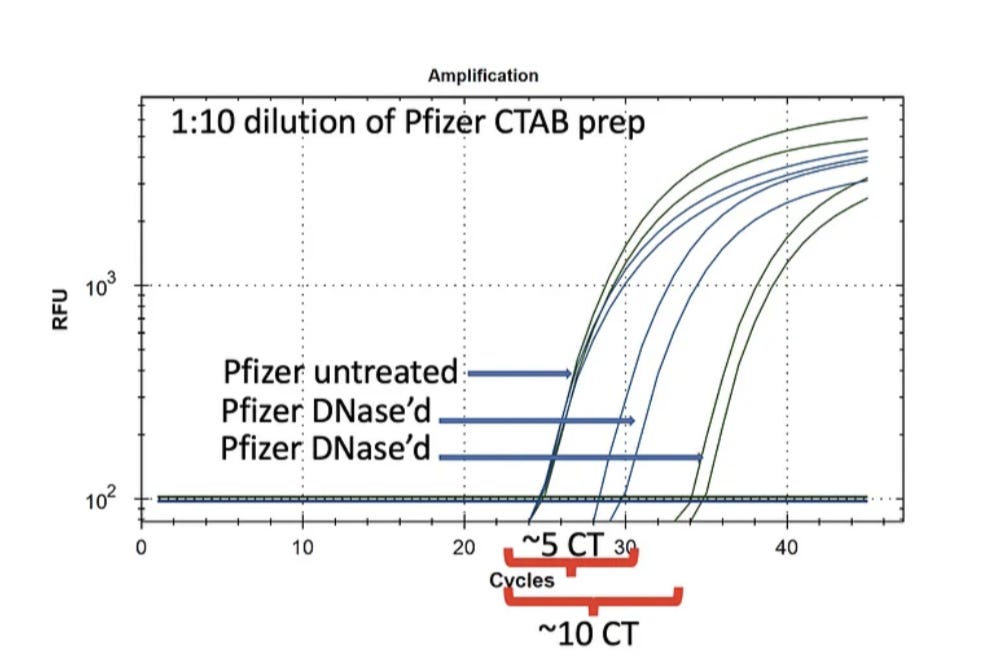
Pfizer nucleic acid purified using a CTAB prep described in previous posts is treated with DNase I and RNase A (NEB). These are run on qPCR and RT-qPCR. qPCR results are shown in Figure 2.

It is clear from these data that DNA is present as DNase treatment creates a 5-10 CT delay shift. Also note the Control CT is ~CT 24 for BOTH the Vector and the Spike sequence. The mRNA doesn’t have a vector sequence and qPCR only amplifies DNA so they should come out on top of each other.
We also ran RT-qPCR on the same plate with the identical thermal cycling conditions. RT-qPCR requires an upfront 10 minutes at 50C to turn RNA into DNA. The qPCR assay has a hot start Taq that isn’t active until 80C so this 50C step should not impair the qPCR results by having it on the same plate and thermal cycling conditions as the RT-qPCR step. This was intentionally performed as a control so the RT-qPCR results could be compared directly to the qPCR results as they are run on the identical cycling conditions.
Figure 3 depicts the RT-qPCR assays performance with DNase I treatment on the left and RNase A treatment on the right. Notice the Blue spike sequence CTs in RT-qPCR are at CT 22 (left red bracket). This is 2CTs lower (more DNA+RNA) than what we measured amplifying just DNA in the qPCR figure 2 on the left. This is expected as RT-qPCR amplifies both DNA and RNA and doubling the input nucleic acids should increment the CT.
A 2CT gain when amplifying RNA+DNA amounts to 4X more RNA than DNA for Spike. This is in line with the 20-35% estimate from the Agilent gels.
Also note, in this assay the Vector and Spike assays are offset several CTs even in the untreated sample. This is an important control as it implies the Vector assay is not performing as well in multiplexed RT-PCR as it is in multiplexed qPCR (CT =28 vs CT = 24). In absence of a qPCR test that demonstrates identical CT for vector and spike as seen in Figure 1, one would conclude this offset is a valid Spike mRNA versus vector DNA proxy. Figure 1 challenges this assumption with identical primer performance in qPCR.
Even though the RT-qPCR vector assay is delayed compared to the spike assay in figure 3 there is still a DNase I offset confirming that the vector signal is comprised of DNA and the DNase I reaction likely isn’t going to completion. An alternative hypothesis would include Vector RNA as a possible contaminant. The RT-qPCR on the right of Figure 3, nullifies this hypothesis as the vector signal doesn’t move with RNase A treatment (4 green lines on top of each other).
If half of the sample is DNA and we cleared 100% of it we would only expect 1-2 CT shift in signal for the Spike channel in blue (Figure 3) as we are using RT-qPCR and this amplifies both DNA and RNA. This is in fact seen with the DNase I RT-qPCR data on the left. By now you’re tired of scroll up and down to follow this logic so I have repasted the figure below for the final pieces of the triangualtion.
The red lines are to illustrate the DNase I offset from the untreated green lines for the vector sequence which we are not expecting any RNA for. The Spike assay in blue only shifts < 1 CT which is what you would expect if the DNA was less than half or in an order of magnitude of the mRNA in the sample.
This DNase I step should be explored with more enzyme and for longer periods of time to ensure its being run to completion. Given this is the step we believe is failing in the vaccine manufacturing, more work is needed to explore if this 2 CT offset can be expanded with more enzyme and time. It is possible the modified nucleotides in the mRNA bind the Spike DNA and alter the kinetics of DNase I activity in their presence.
The data on the right of figure 3 explores RNase A treatment of the sample. In this case there is a significant reduction in Spike signal but the DNA based vector does not move at all. The red lines are the DNase I samples from the left figure (superimposed for comparisons).
One would expect the RNase treatment to leave you with identical vector and spike CT signal as the DNA from the plasmid can still amplify with RT-qPCR and can’t be digested by RNase A. If you lower the baseline threshold which is defaulted to 10^2 on the Y axis, you’ll note these lines actually converge on similar CT but the vector assay is amplifying to higher magnitudes and more efficiently than the spike assay. The steeper the slope of the CT curve signals a more efficient amplification reaction in the vector assay. Further optimization of the primer and probe ratios in RT-qPCR is warranted but these results resonate with high levels (with in a similar order of magnitude as the mRNA) of DNA contamination in the vaccines.
Conclusions
These results are a preliminary assessment to ascertain if the DNA and RNA are in the same order of magnitude of concentration. Longer RNase and DNase treatments are needed to further refine these data. Even with this preliminary glance, significant evidence triangulates on excessive DNA in these samples and its roughly in the same order of magnitude as the RNA. This is congruent with our Agilent electrophoresis data and exceeds the EMA specifications by at least an order of magnitude. The second order of magnitude may vary lot to lot or method to method.
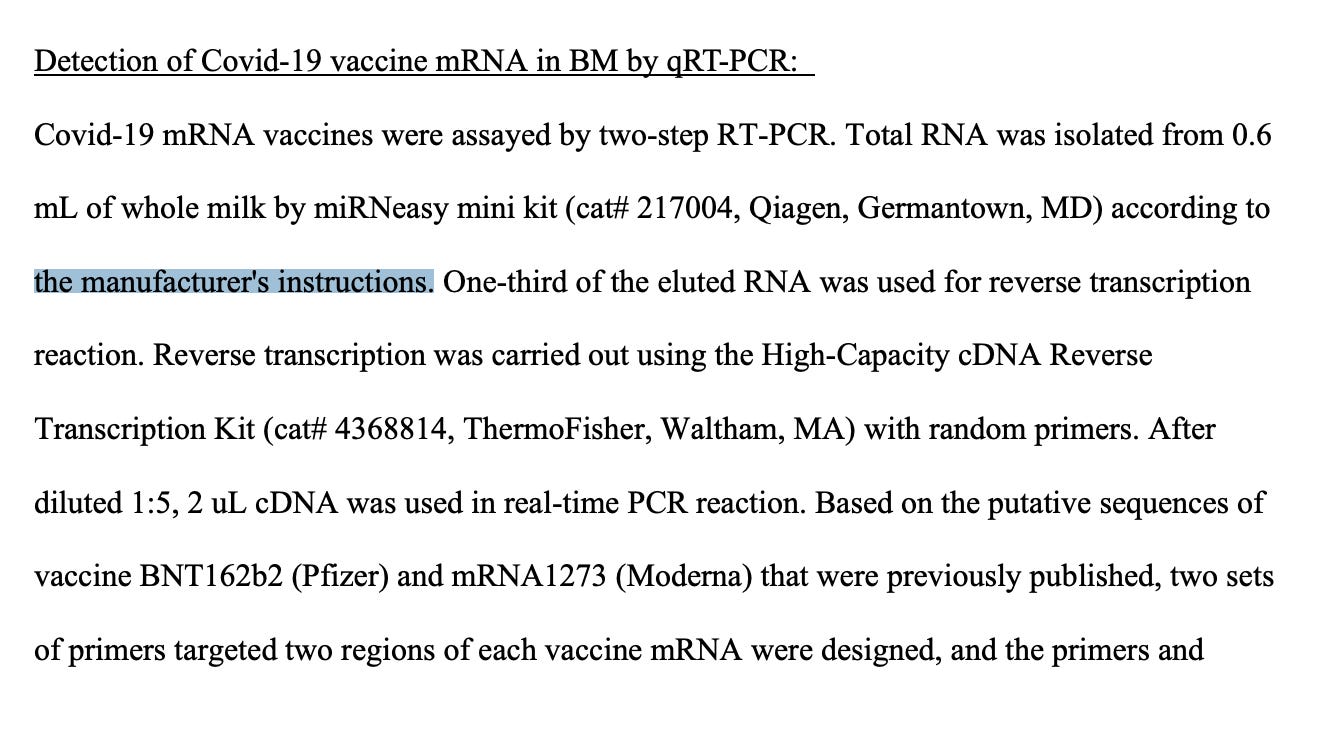
These qPCR and RT-qPCR assays may be of interest to parties examining vaccine clearance rates with healthy and injured patients. Studies have found vaccine mRNA in breast milk and plasma but theses studies used RT-qPCR which could have amplified background plasmid DNA if DNases were not used in the RNA isolation. For the breast milk study Hannah et al. used a Qiagen kit according to the manufacturer’s instructions. This kit has an optional on-column DNase I step and its not clear if this was used for this study.
The assay may also be pertinent to the study of LINE-1 reverse transcriptase activity which could easily be mistaken for plasmid dsDNA contaminants in the vaccine if the vector sequence isn’t ruled out. Reverse transcription of vaccine mRNA should not result in DNA with vector sequence however the vector’s spike DNA and the spike mRNA may create Reverse transcriptase activity false positives. Contact us if you are interested in collaborating on this field of study.
Methods
We will update the DNase I and RNase A methods section once we complete a few more experiments on DNase I concentration and time courses. For this study we followed the recommend Units/assay for each enzyme from our supplier at NEB in terms of units/ug. We used the same time and temperature for each enzyme (37C for 20 minutes assuming a 1ug input). Samples were all re-purified with SPRI after these incubations. This re-purification included the Pfizer untreated control to account for Purification loss after enzymatic treatment.
qPCR conditions
qPCR utilized Medicinal Genomics PathoSEEK qPCR master mix kits and PathoSEEK RT-qPCR kits . 1ul of sample was used for qPCR and RT-qPCR. qPCR used 13.8ul mastermix according to the manufacturer’s instructions. 4ul of ddH20 and 1ul of DNA was added to the 13.8ul of qPCR mastermix. RT-qPCR used a 10ul Mastermix formulation and a 1ul DNA addition.
Cycling
50C -10 minutes
95C 3 minutes
1)95C 15 secs
2)65C 30secs
3)Goto 1) 44 cycles


So is this a way to fight them? Based on the product not being as specified as per the contract due to excessive contamination?
I mean if it is easier to prove the product is defective, rather than dangerous. Dangerous requires a lot more evidence, while product purity is to a set level of compliance.
This is awesome work. What a trainwreck.
Is it possible to transfect human cells with the product and culture them, then check if their descendants conserve the ability to produce spike, or have the plasmid DNA integrated into their genome?