A novel qPCR detection chemistry to address the quantitation of fragmented DNA populations
LIDAR

Since the roll out of mRNA vaccines, there has been an active debate regarding the safety of residual DNA found in the vaccines and if prior FDA/WHO guidelines were crafted with LNP transfection in mind. Prior guidelines for injected vaccines that lack transfection reagents placed the limit at 10ng/dose of DNA over 200bp in size. But this guideline was based on long DNA and acknowledged that short DNA of the same weight contains orders of magnitude more copies of DNA and thus require LOWER limits.
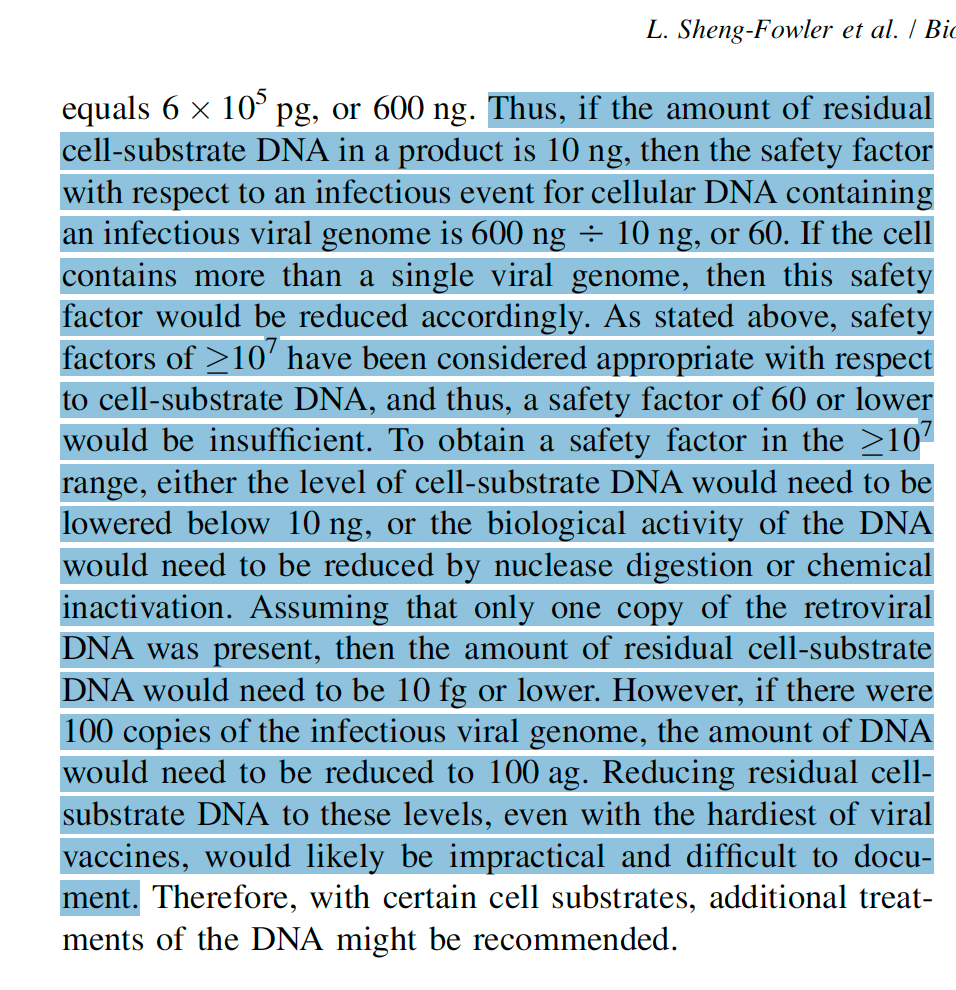
This paragraph is from Keith Peden’s and Sheng-Fowler’s work from the FDA. The basis for the claim to safety rested on the injected DNA being naked and exposed to nucleases that would destroy <200bp fragments quickly. The half life of naked DNA in the blood is often cited as the basis for this degradation rate. It’s under 10 minutes and shorter DNA degrades faster.
However, this degradation rate does not apply to LNP protected DNA and with the DNA being short, it may not encode entire oncogenes but it still contains functional promoters, hypermutability elements, origins of replication and microORFs. Some DNA fragments sequenced with Oxford Nanopore contain the entire spike Open reading frame with a cryptic mammalian promoter (ColE1), suggesting full spike expression is hypothetically plausible from the transfected DNA given the Pfizer plasmids also contain nuclear localization signals in the SV40 Enhancer.
Given the plethora of data now published on spike persistence in patients with LongVax, you would think regulators would be very interested in this being a primary hypothesis for the source of continued spike detection in patients years after vaccination.
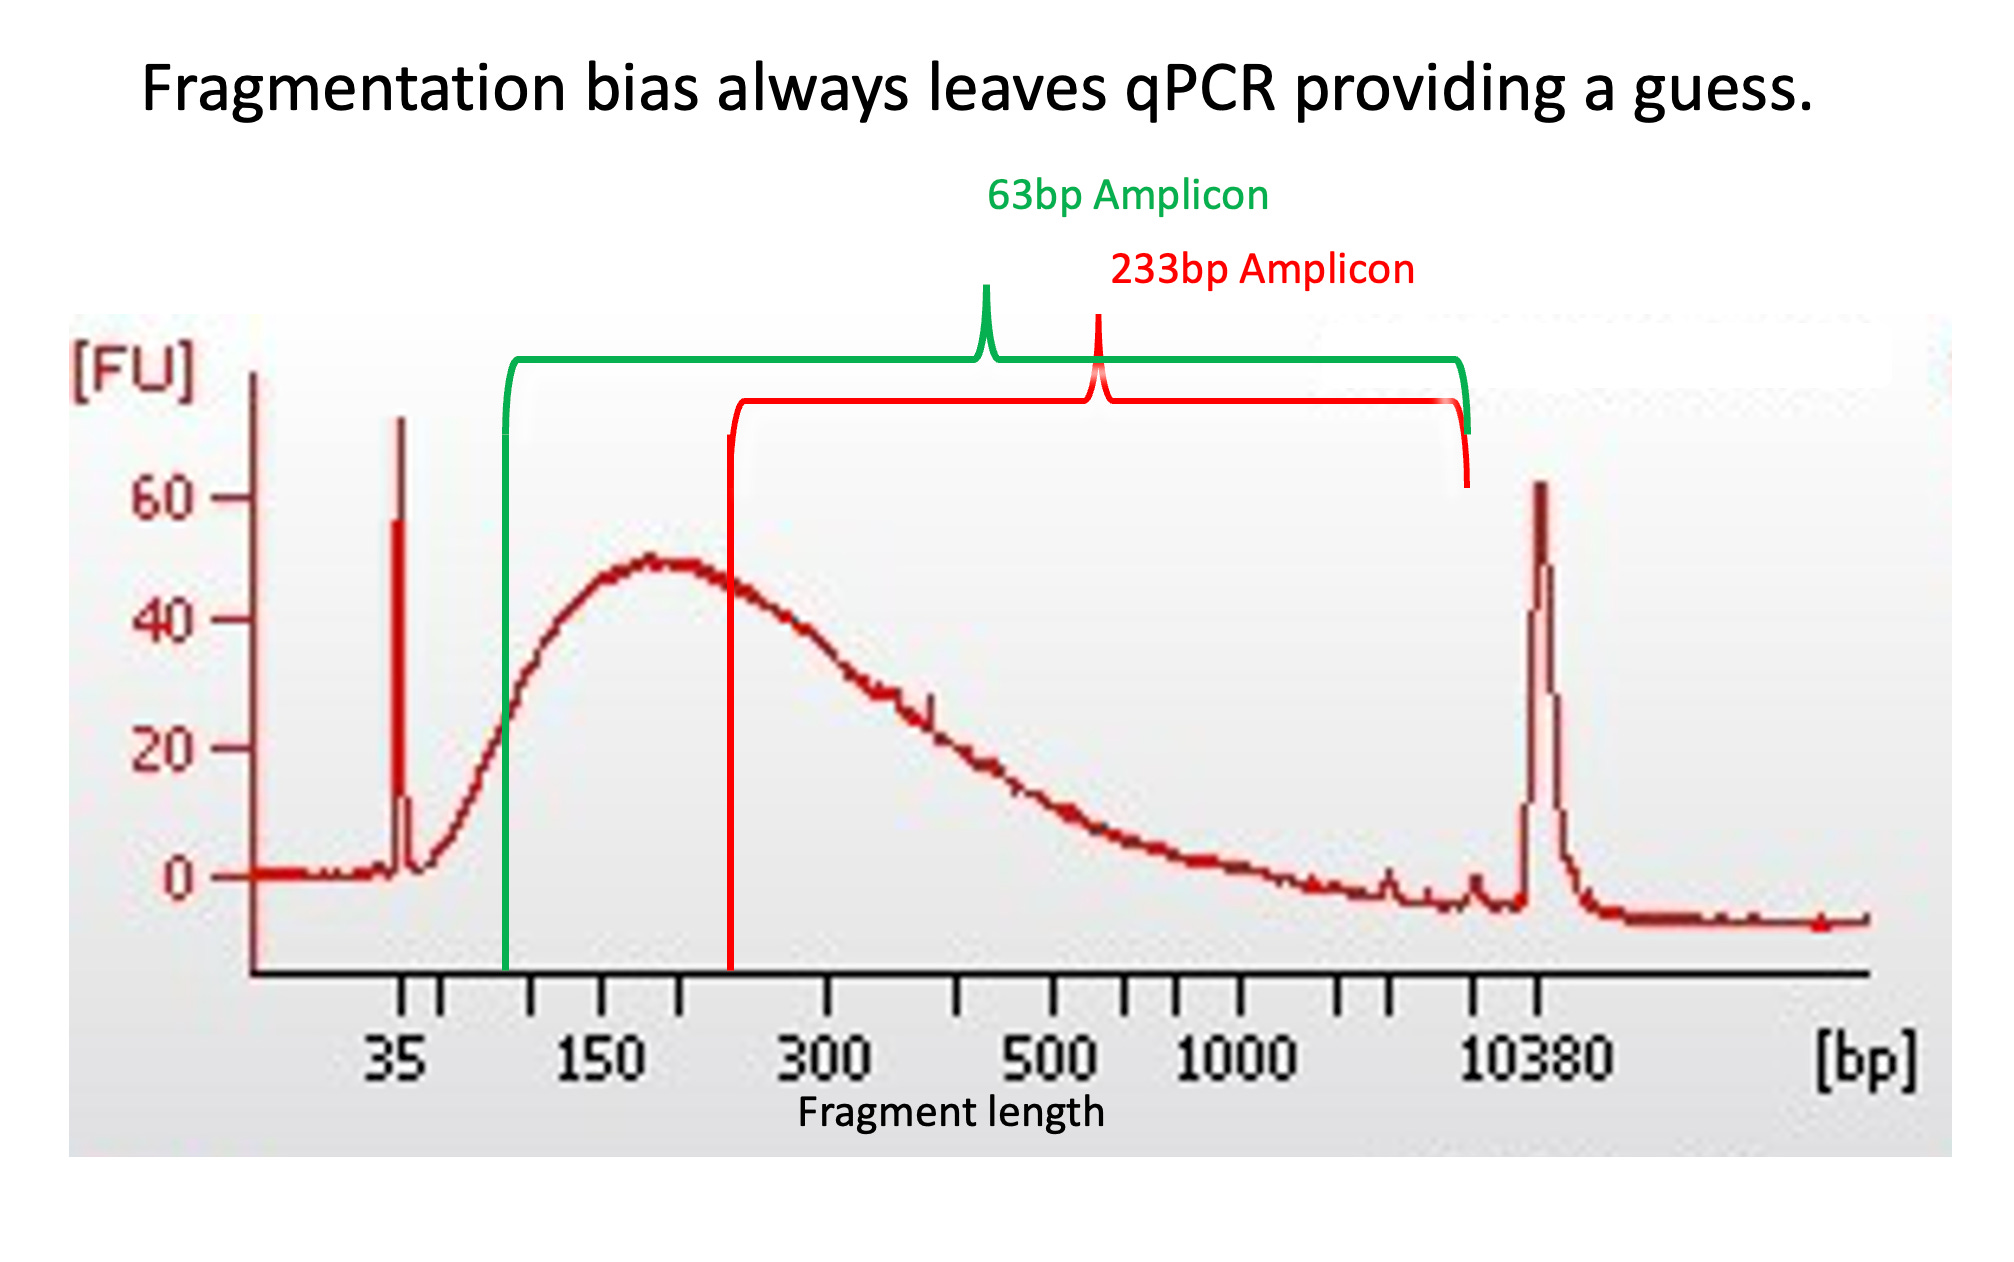
So exactly how much small DNA is in these shots? This has been a notoriously difficult question to answer as the regulators are using qPCR tools incapable of measuring it. Once the DNA is fragmented, qPCR with 200bp amplicon sizes fail to measure the majority of the product. Fluorometry has been suggested as an alternative but Georgiou et al has demonstrated that PicoGreen also suffers from 70% under reporting from DNaseI treated DNA. While the Fluorometry reports much more DNA than large amplicon qPCR, it still under reports the digested DNA.
McKernan et al has also demonstrated that the DNaseI used to fragment the plasmid DNA in the vaccines does not process RNA:DNA hybrids thus leaving 100 fold more spike DNA than Ori or plasmid DNA. This Spike/Ori qPCR delta CT has now been observed in many studies but surprisingly doesn’t exist in all lots demonstrating lot to lot heterogeneity in the spike DNA contamination. This variable has gone un-noticed by regulators as they are only using a single qPCR assay outside of the DNaseI protected spike region to assess the residual DNA load.
Why are they allowing a single qPCR assay to monitor this problem when C19 testing demands multiple qPCR assays to address the virus? This is a double standard they refuse to address.
What is known from a FOIA request from the TGA is that the regulators are using a Kanamycin Taqman assay which they refuse to disclose the details of. Taqman based qPCR suffers from its inability to target small DNA. This detection method requires a 3rd known sequence (a probe) to generate its signal and this 3rd sequence requires DNA of certain size (over 75bp) to afford detection. SYBR Green is often used in its place as it has no requirement for a 3rd sequence, however SYBR Green is a single color assay and forces one to sacrifice the spectral multiplexing offered by 5 color Taqman in order to obtain small amplification. Uniquely SYBR Green affords high resolution melt (HRM) capabilities that Taqman cannot provide.
Researchers downgrading to single color SYBR can still recapture some multiplexing capabilities if they design their target amplicons to have different melting temperatures in the HRM domain.
A quick review on HRM.
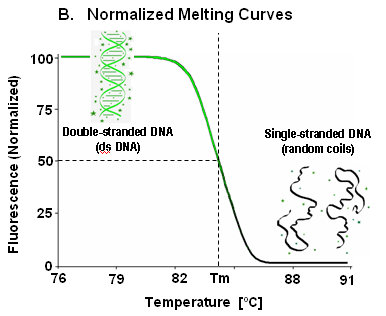
After qPCR, most thermal cyclers can ramp the temperature up from 50°C to 95°C and monitor the signal through this thermal ramp. When using intercalating dyes like SYBR Green which only fluoresce in the presence of DOUBLE stranded DNA, you will witness a drop in SYBR Green signal as the target amplicon reaches its melting temperature and becomes SINGLE stranded DNA. This is an important piece of information you can use to confirm what target actually amplified.
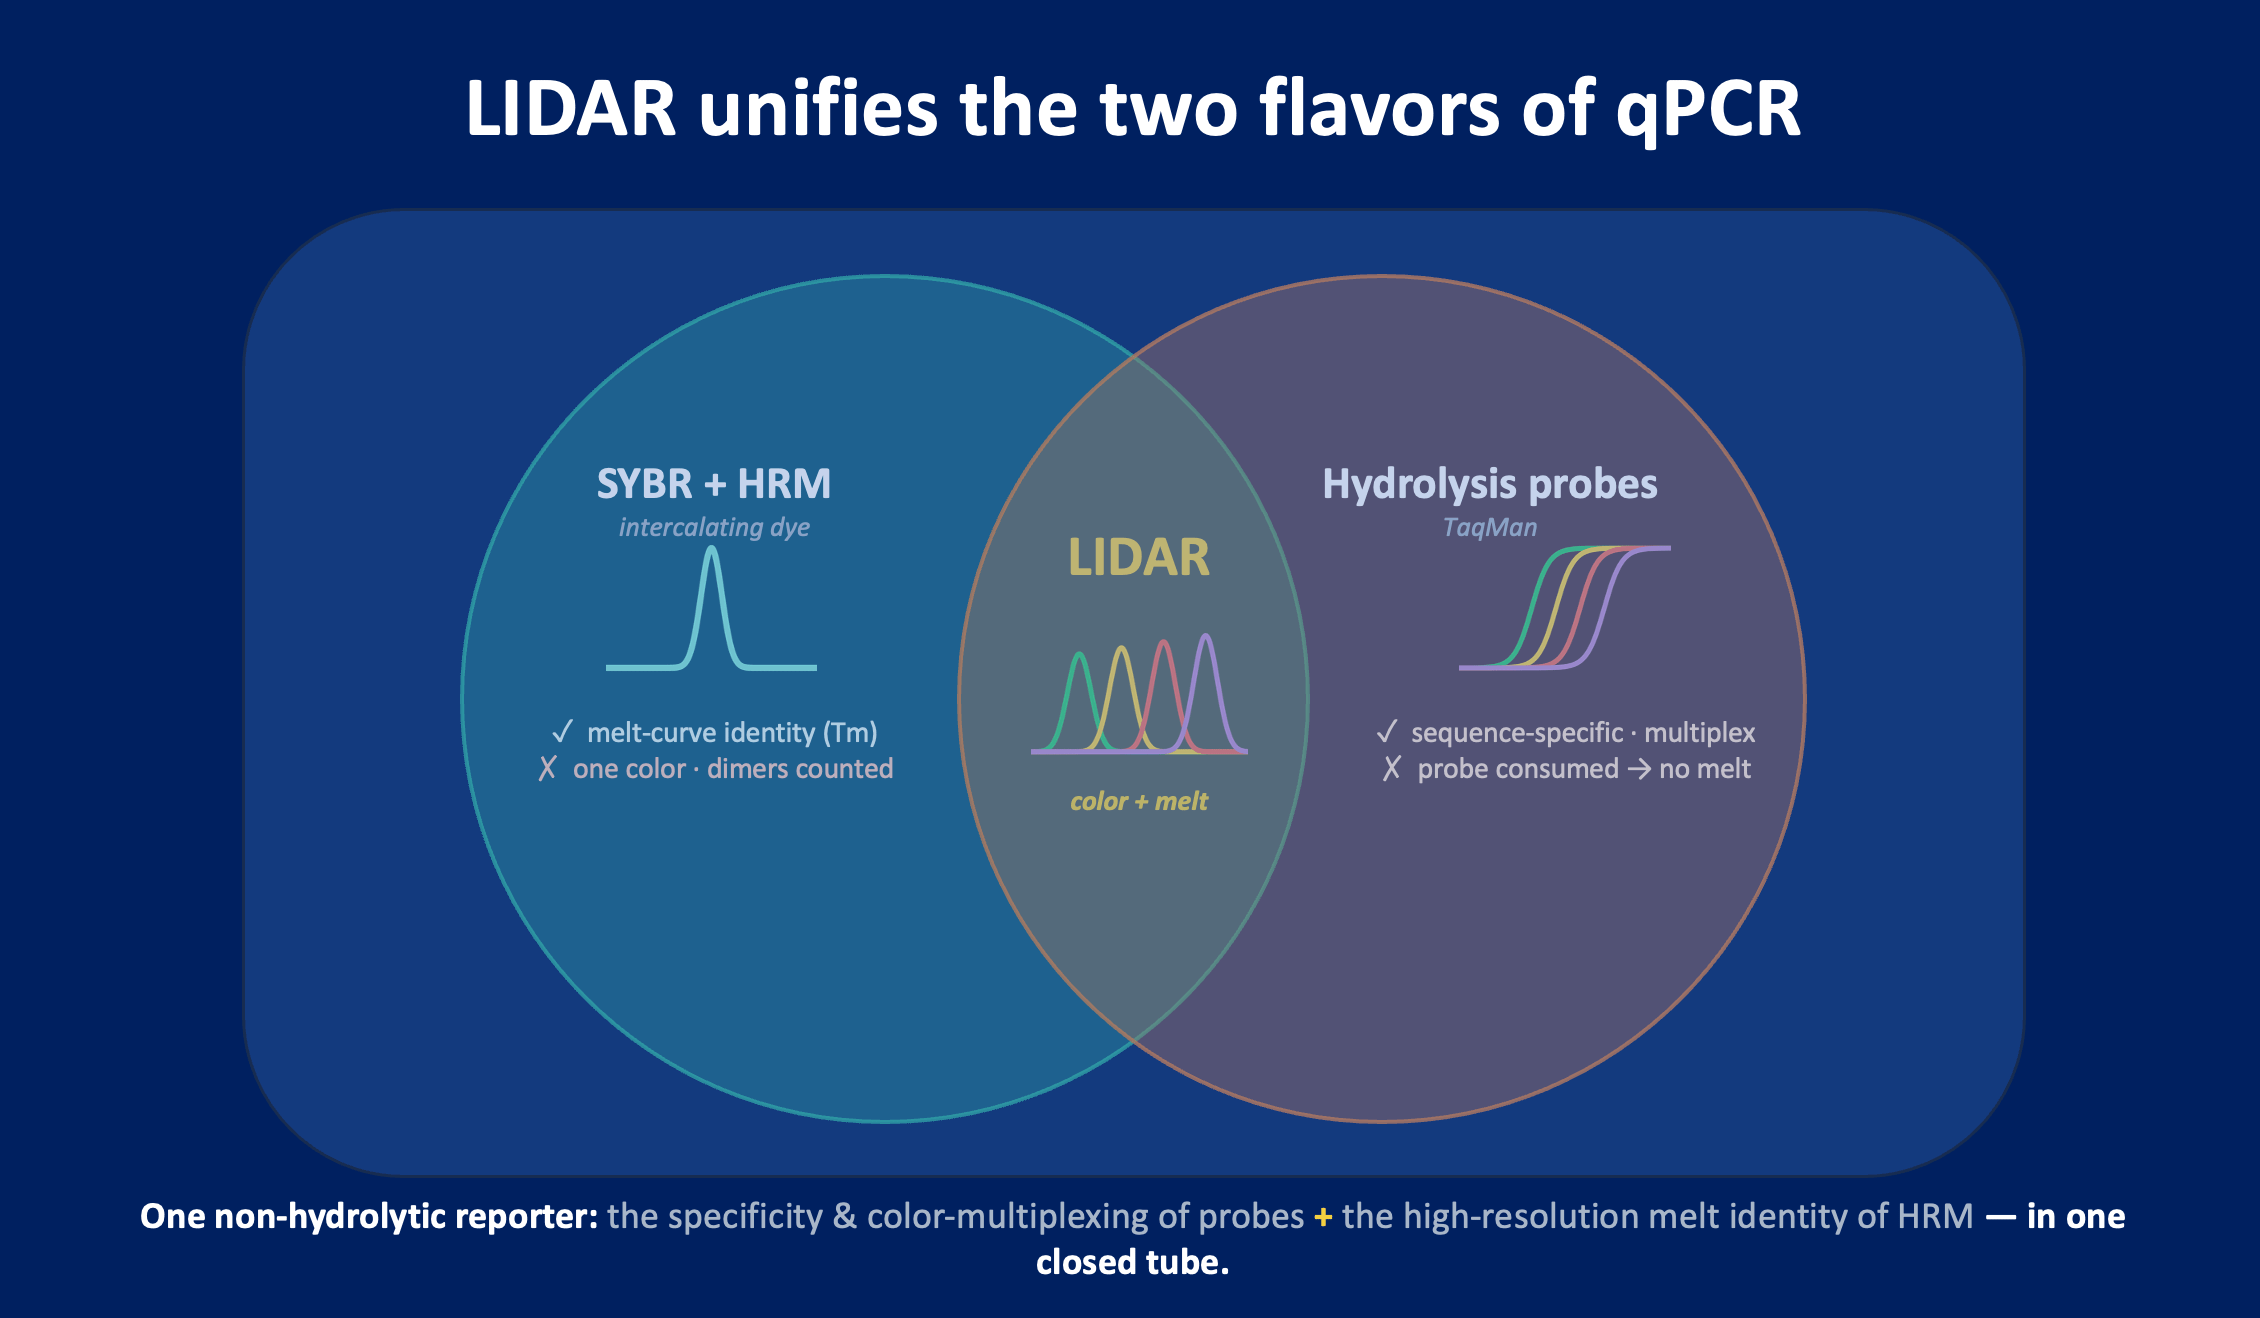
At CannMed 2026, we presented a novel qPCR technology known as LIDAR qPCR that unifies the tradeoffs between SYBR Green HRMs and Taqman while retaining the capacity to amplify small DNA in 5 colors with HRM capability.
https://rumble.com/v7bpsoi-lidar-qpcr-from-medicinal-genomics.html
We then applied these new tools to the detection of various pathogens and variable sized DNA targets in the mRNA vaccines.
To address this problem, we first engineered a novel qPCR detection method that does not use irreversible hydrolysis (FEN1 activity in Taqman polymerases) as a dequenching mechanism. Taqman cannot perform HRMs because it relies on the irreversible destruction of the probe to liberate a Quencher from a Fluorophore.
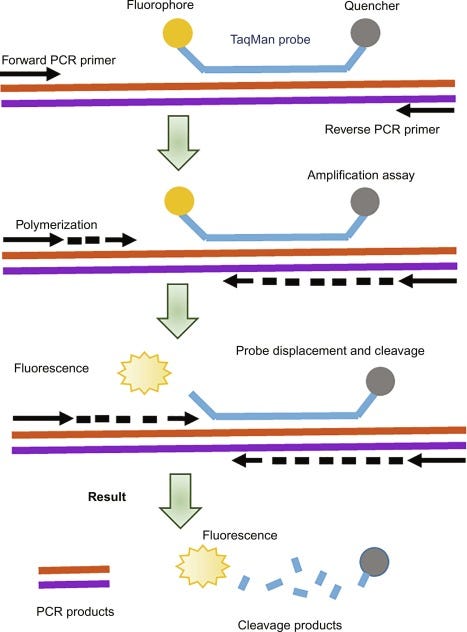
Once the Quenchers are cleaved from the dye, subsequent cooling and heating provides no additional information on the target DNA. SYBR Green on the other hand, has dyes that can melt from DNA and re-associate providing a reversible ON and OFF signal based on thermal conditions. Unfortunately, these intercalating dyes have a very broad excitation and emission spectra and consume the majority of the visible spectrum on qPCR instruments such that only 1 color can be used.
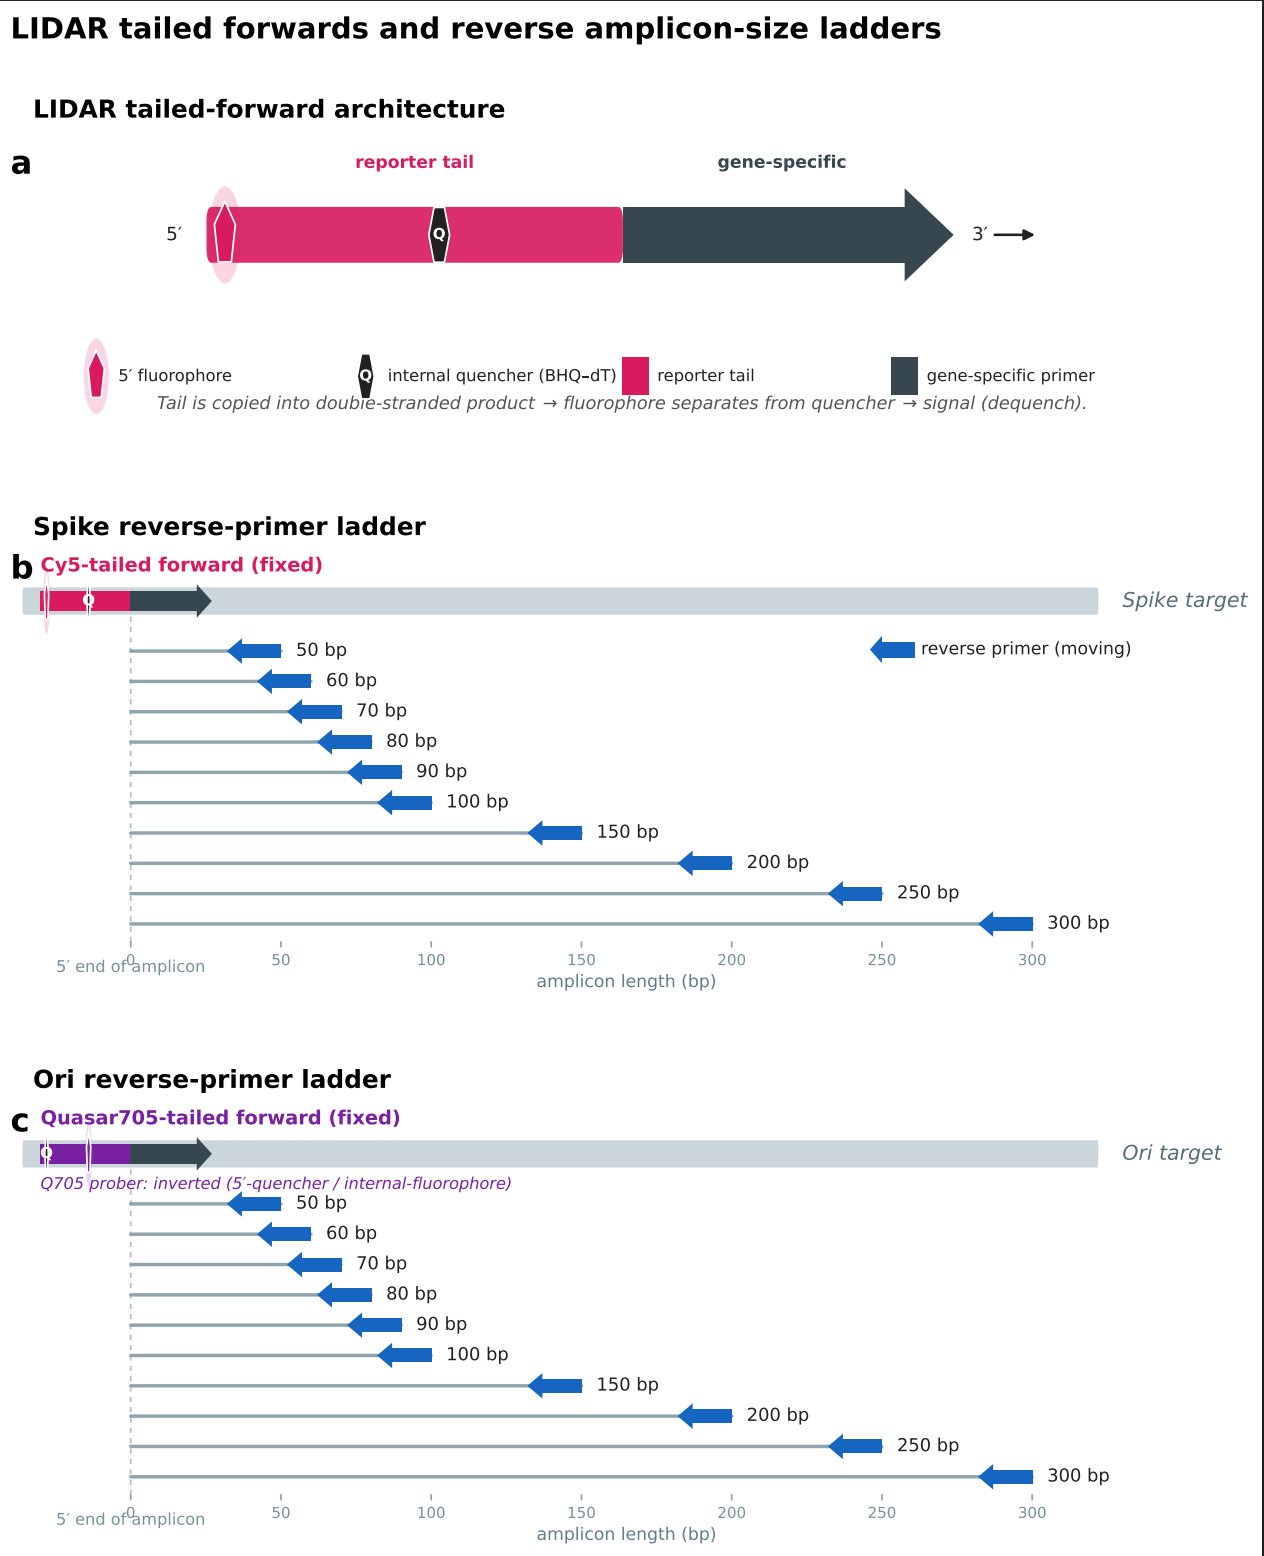
To obtain this capability with 5 color fluorescence, we engineered PCR primers that act as Probes or “Probers”. These engineered Probers have a Fluorophore-Quencher (F-Q) in close proximity in a single stranded primer but distanced from one another by 3.4 Angstroms per base once the ssDNA is forced into the helical pitch of double stranded DNA. Thus the formation of the helix longitudinally separates the Dye from the Quencher and this is a reversible 5 color signal similar to SYBR Green. Hence the term LIDAR or Longitudinal ID of Amplified Reporters.
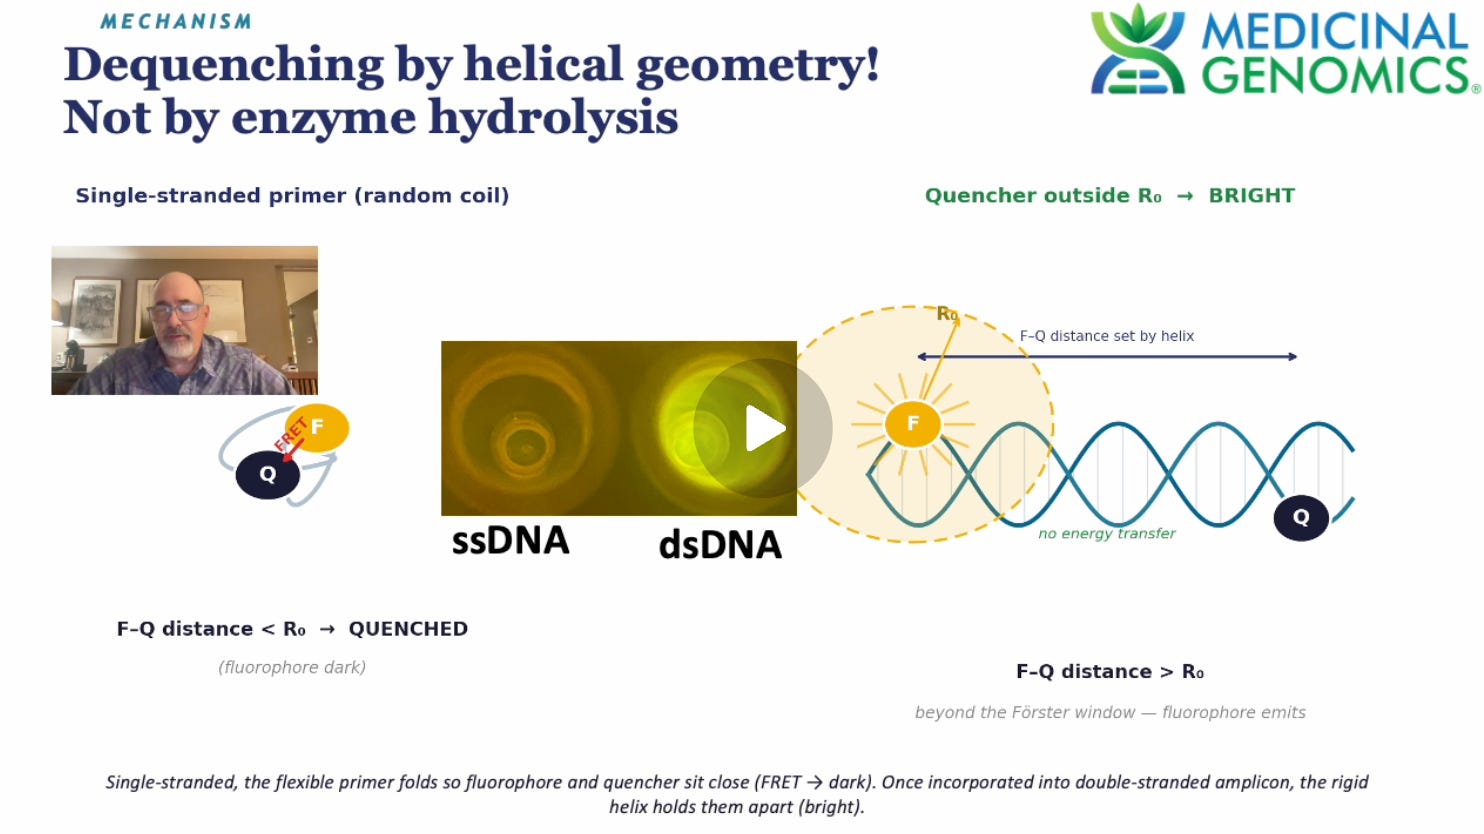
These Probers can then be used on the 5’ end of PCR primers and consume zero internal DNA real-estate for amplification and thus capture small DNA just like SYBR Green.
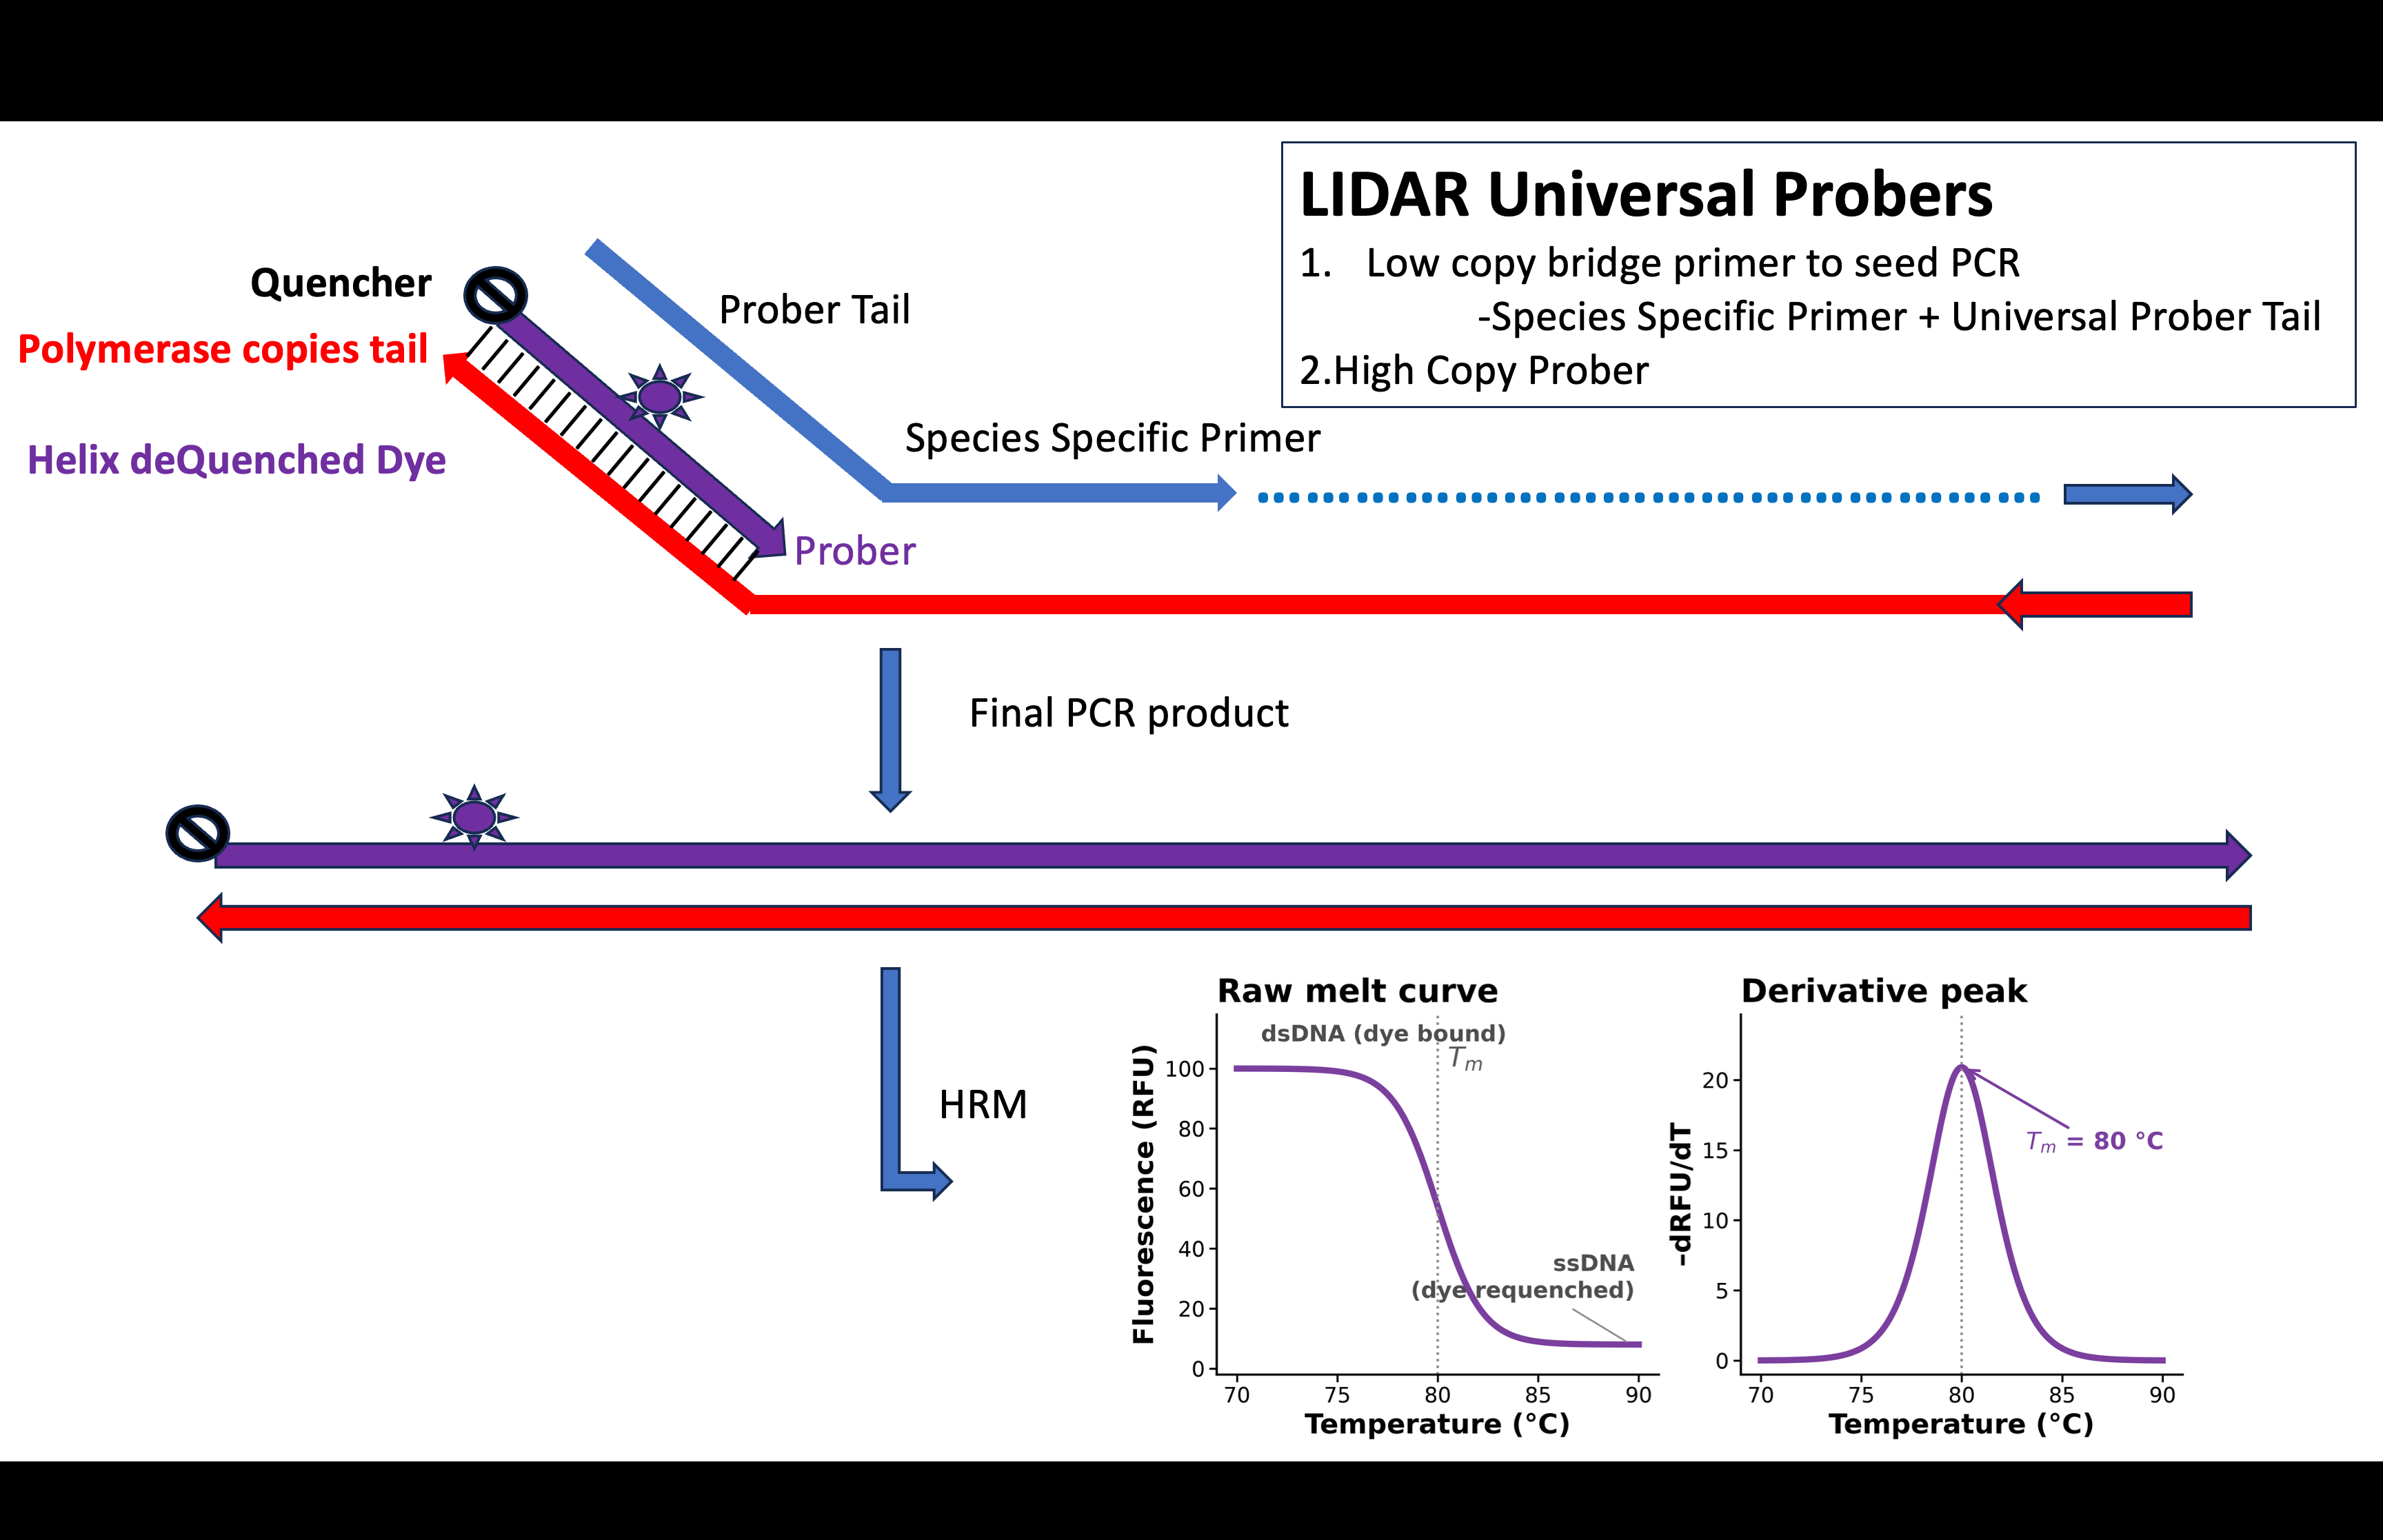
This PCR reaction tailing is an important detail to zero in on as it is the cost driver of Taqman based qPCR. The synthesis of an internal custom dye labeled probe is usually about $300 where unlabeled primers are closer to $15. So every time you want to target a new organism with Taqman, you find yourself synthesizing another $300 probe.
By putting this reporter on a 5 prime tail of a primer, you can make that sequence whatever you want and the same for every organism you want to target. You simply need to synthesize an unlabeled bridge primer that unites your species specific primer to your LIDAR reporter. For instance, the sequence in yellow below is the LIDAR sequence for the Quasar705 LIDAR bridge primer and the black sequence is the ORI target. We can easily swap out these unlabeled bridge primers with different prober tails if we want to change colors for a given assay.

Below is the Cy5 Bridge primer for Spike. Note these are unlabeled bridge primer but the prober sequence with the LIDAR Fluorophore and quencher are same sequence as you see in their respective color, only with 2 modifications (Dye and Quencher).

Since the reporter target is on the bridge primer tails, they are universal. We can now make these reporters in bulk and not have to pay for a novel Taqman probe for every new assay. This is critical to cost reductions as bulk synthesis of labeled reporters scales. If you want 10X more synthesized, it usually only costs you 3X more.
5 Color LIDAR
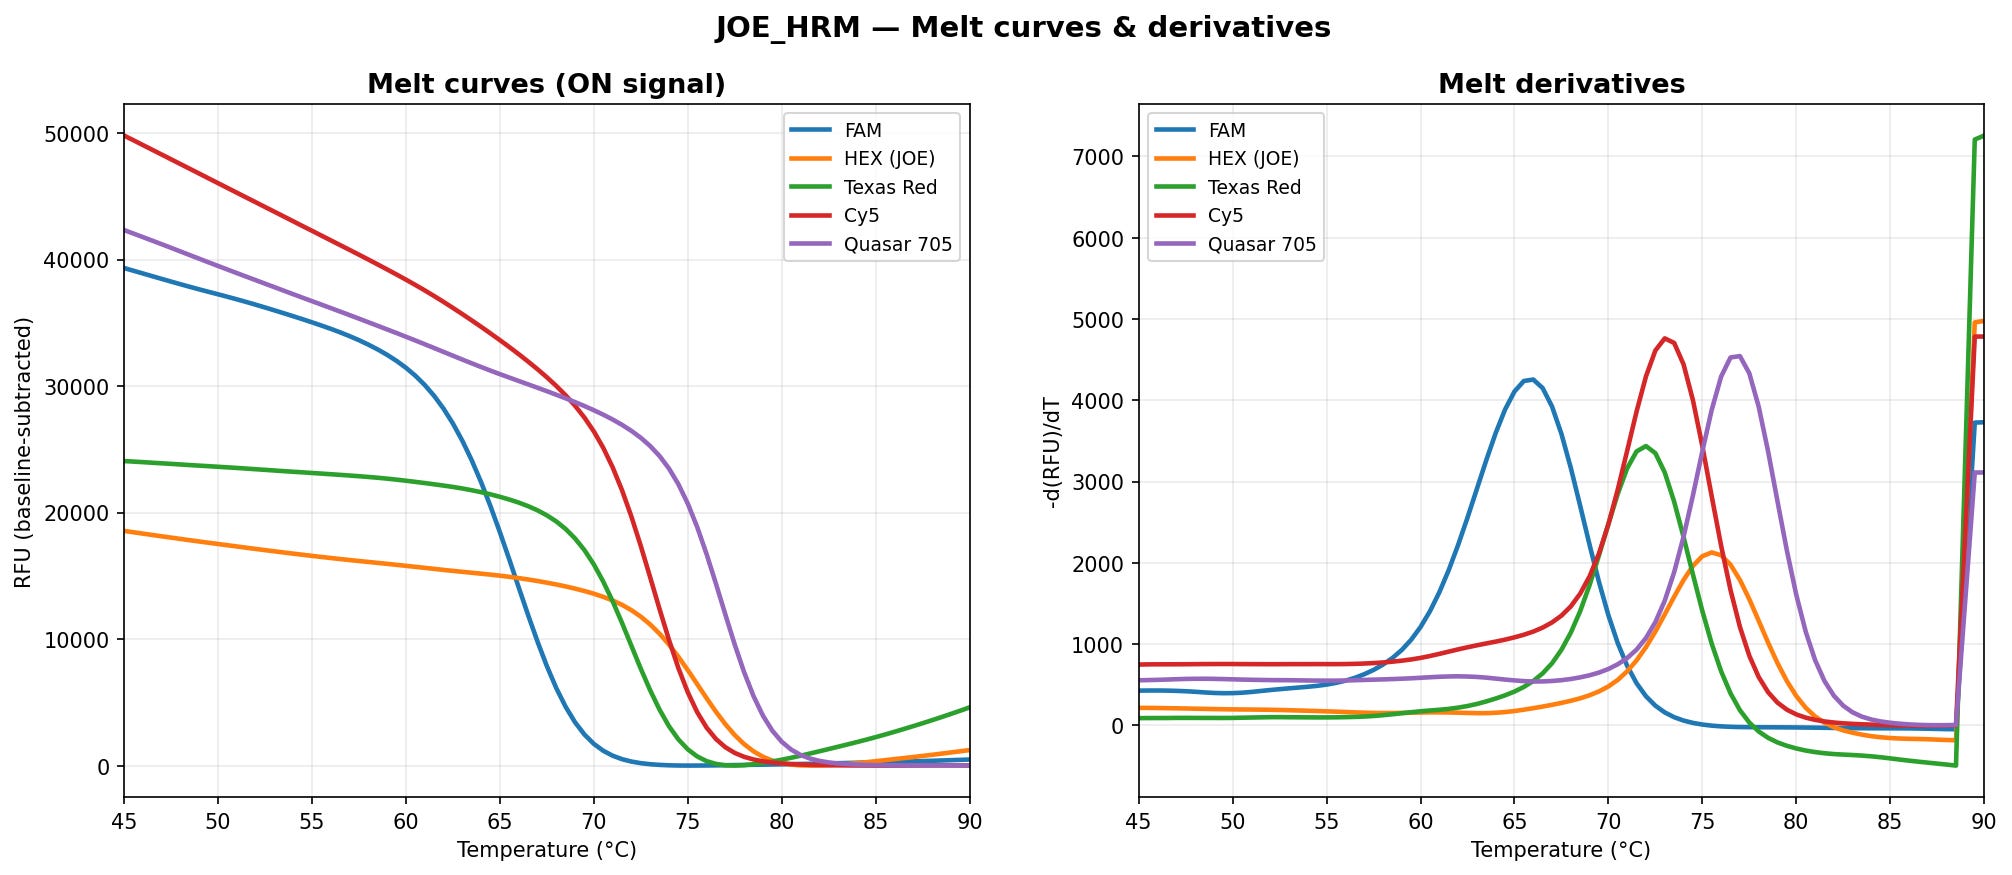
Below is an example of a 5 color HRM using LIDAR probers. They maintain signal at low temperature (left) but as you raise the temperature and melt the strands from their targets, they go back to single stranded state and continue acting as quenchers.
Now that we have multi-channel (multiple colors) HRMs we can entertain targeting more than one region in the vaccine plasmid to address McKernan et al’s concerns over using a single KAN target as a proxy for DNA content after a complex and non-uniform DNaseI digestion.
Similarly, now that we also have HRMs, we can create a qPCR tiling of 50bp, 60bp, 70bp, 80bp, 90bp, 100bp, 150bp, 200bp, 250bp and 300bp target amplicons to measure the actual fragmentation rate in the DNaseI treated vaccine. How much more DNA is detected if your amplicons are 50bp vs 300bp?
Below is a depiction of this effect using SYBR Green. 60bp amplicons present a CT of 13 while 300bp amplicons deliver a CT of 17.5 in the Pfizer Vaccine.
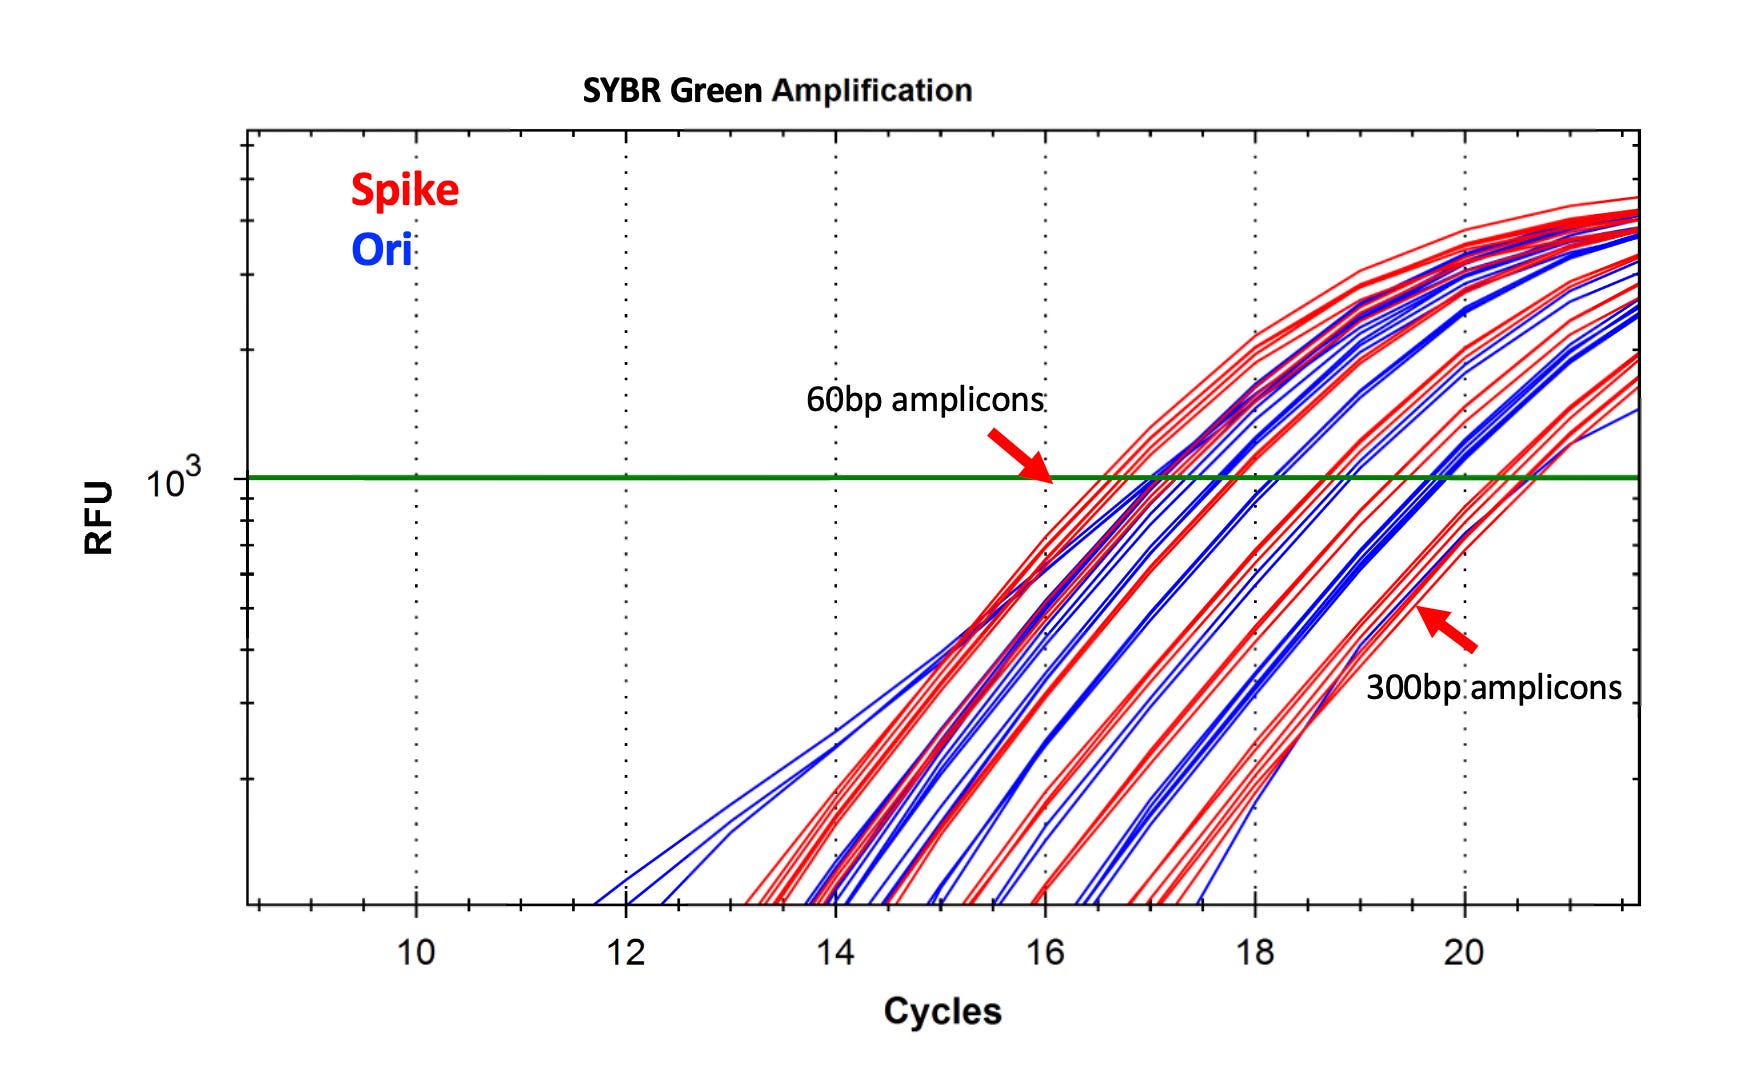
This 4-5 CT difference in small versus large amplicons equates to a 16-32 fold (2^4, 2^5) variance that alone could account for the reason why the regulators can’t see this problem. They have never disclosed the size of the amplicon they are using and these methodological details remain redacted and confidential to this day. As you can see, use of a larger amplicon could easily tip the scales to a passing sample when it in fact has 32 fold more DNA than they claim.
Similar offsets are seen with LIDAR although the effect is more pronounced due to the subtleties of the photophysics.
SYBR Green stains DNA with a small-8bp footprint so the longer your DNA amplicon, the more SYBR Green it recruits. This overestimates the larger DNA compared to the smaller DNA. This is the exact photophysics effect described by Georgiou et al who measured a 70% loss in quantitation (with the intercalator PicoGreen) once you fragmented the DNA into smaller pieces with DNaseI.
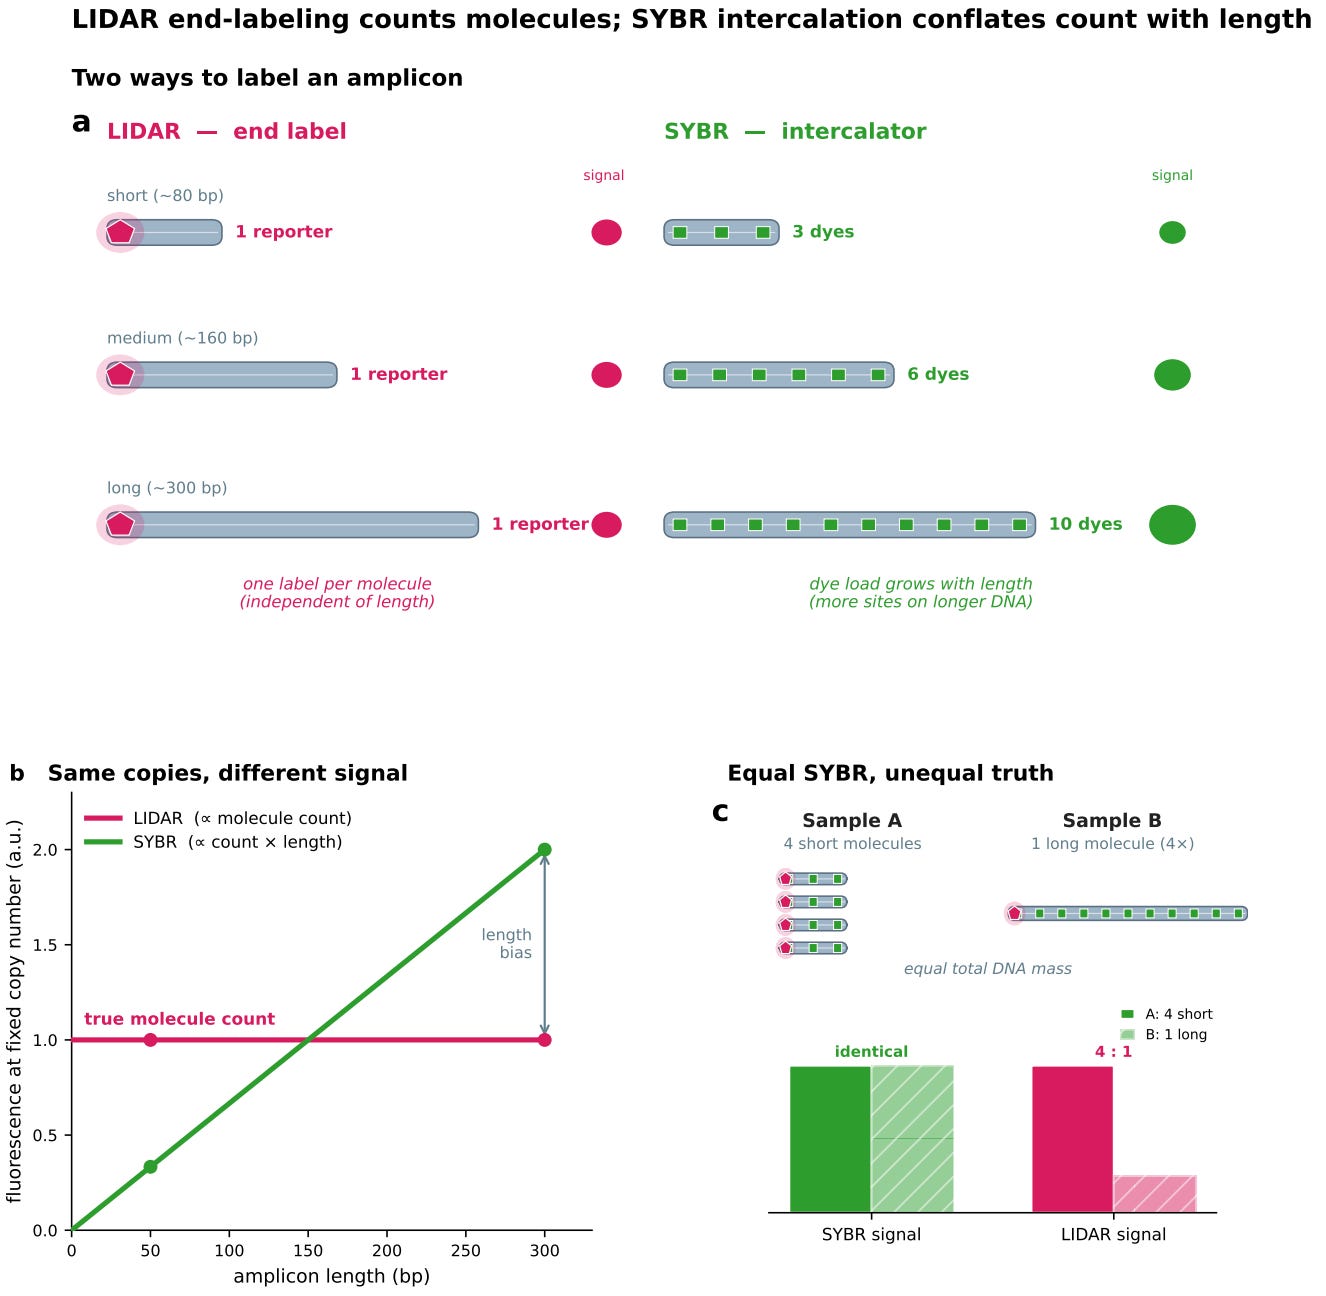
LIDAR end labels the DNA with 1 dye molecule per amplicon and provides a more direct measurement of the quantification of DNA molecules. In this case we chose a Pfizer vial that did not show the 100 fold offset of Spike vs Ori DNA as we want both targets to be operating in the same dynamic range for these optimizations. This 100 fold spike-ori offset is discussed in Speicher et al and McKernan et al and is now known to be an artifact of DNaseI failure to digest DNA that is shielded by RNA (RNA:DNA hybrids). However, not all lots show this artifact which is in itself a manufacturing variance that should have created a halt on the vaccines.
When running these SYBR qPCR assays on the vaccine, you need to have a non fragmented synthetic control to compare them to. These are known as gBlocks from IDT.
Below is the SYBR Green HRM of the 50bp-300bp amplicons. The larger amplicons have higher melt temperatures as expected. These had to be run in independent qPCR wells as SYBR is single color and the Red/Blue coloring in the below charts is a pseudo-coloring to afford overlay and comparisons of spike and ori amplicons. HRMs provide added confidence that your PCR reaction is producing the expected amplicon.
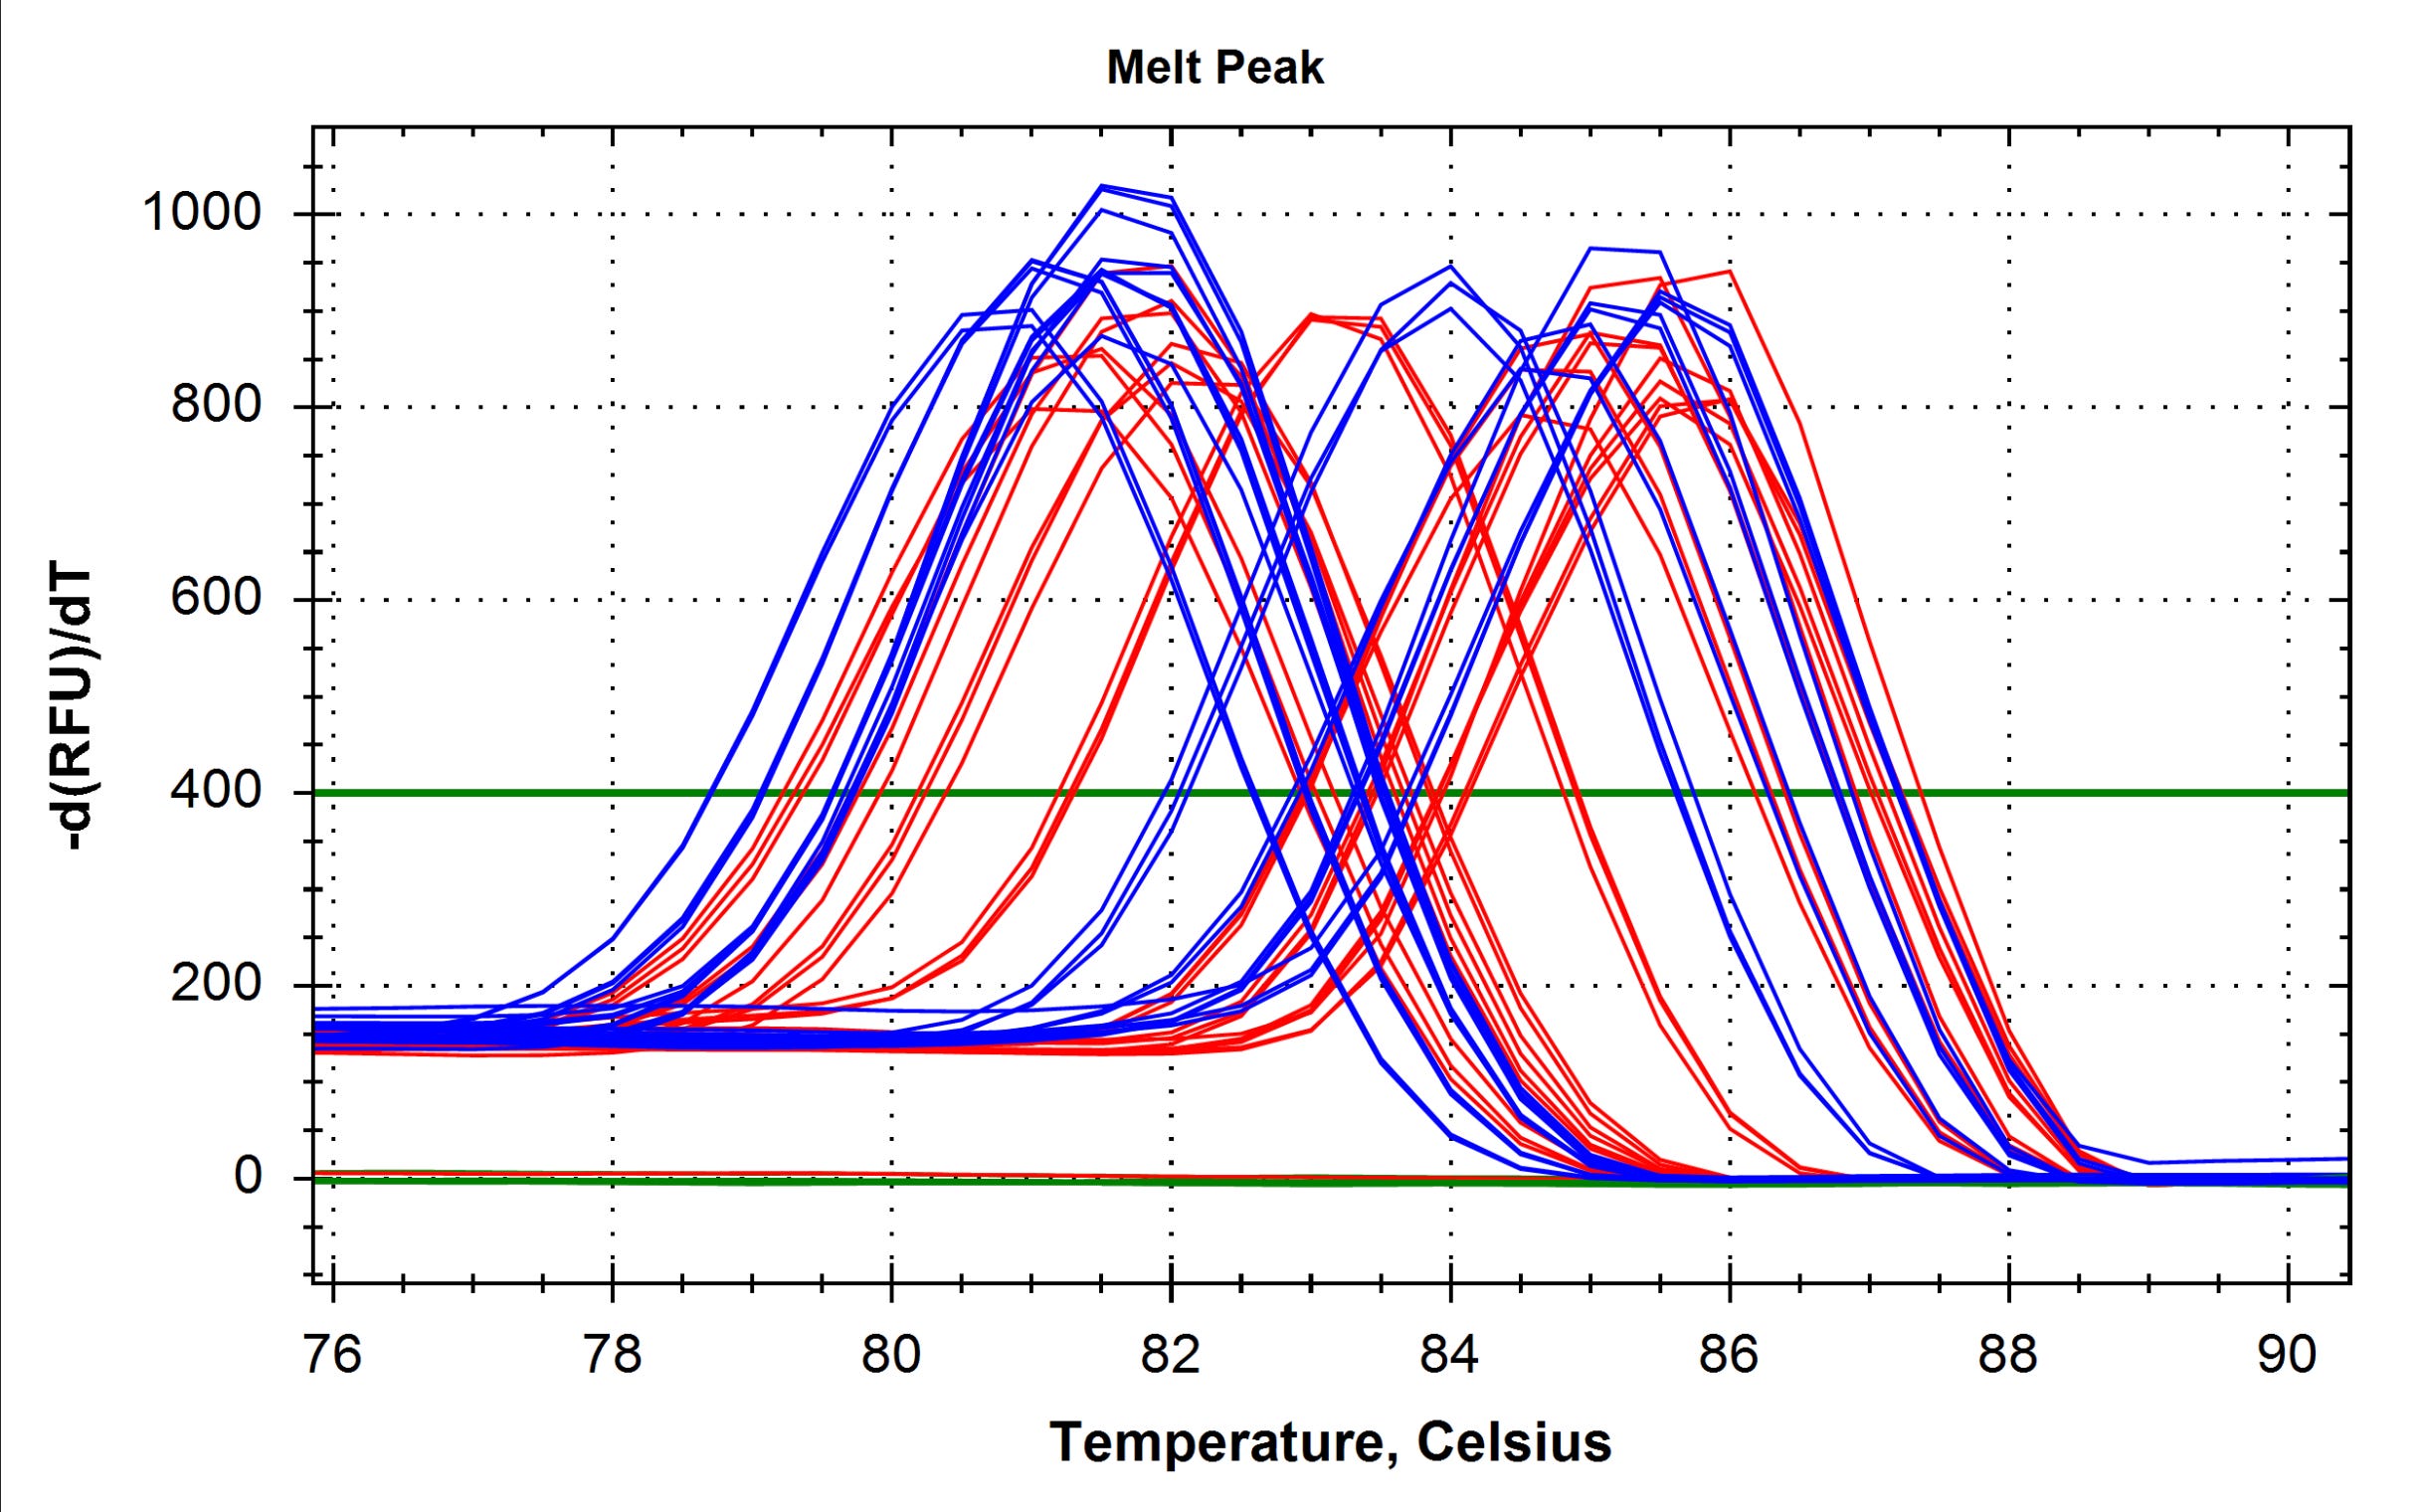
LIDAR changes the multiplexing dimensionality. We can Run Spike assays in CY5 and Ori in Quasar to obtain both targets in a single well.
Below is the LIDAR HRM of the CY5 spike amplicon series.
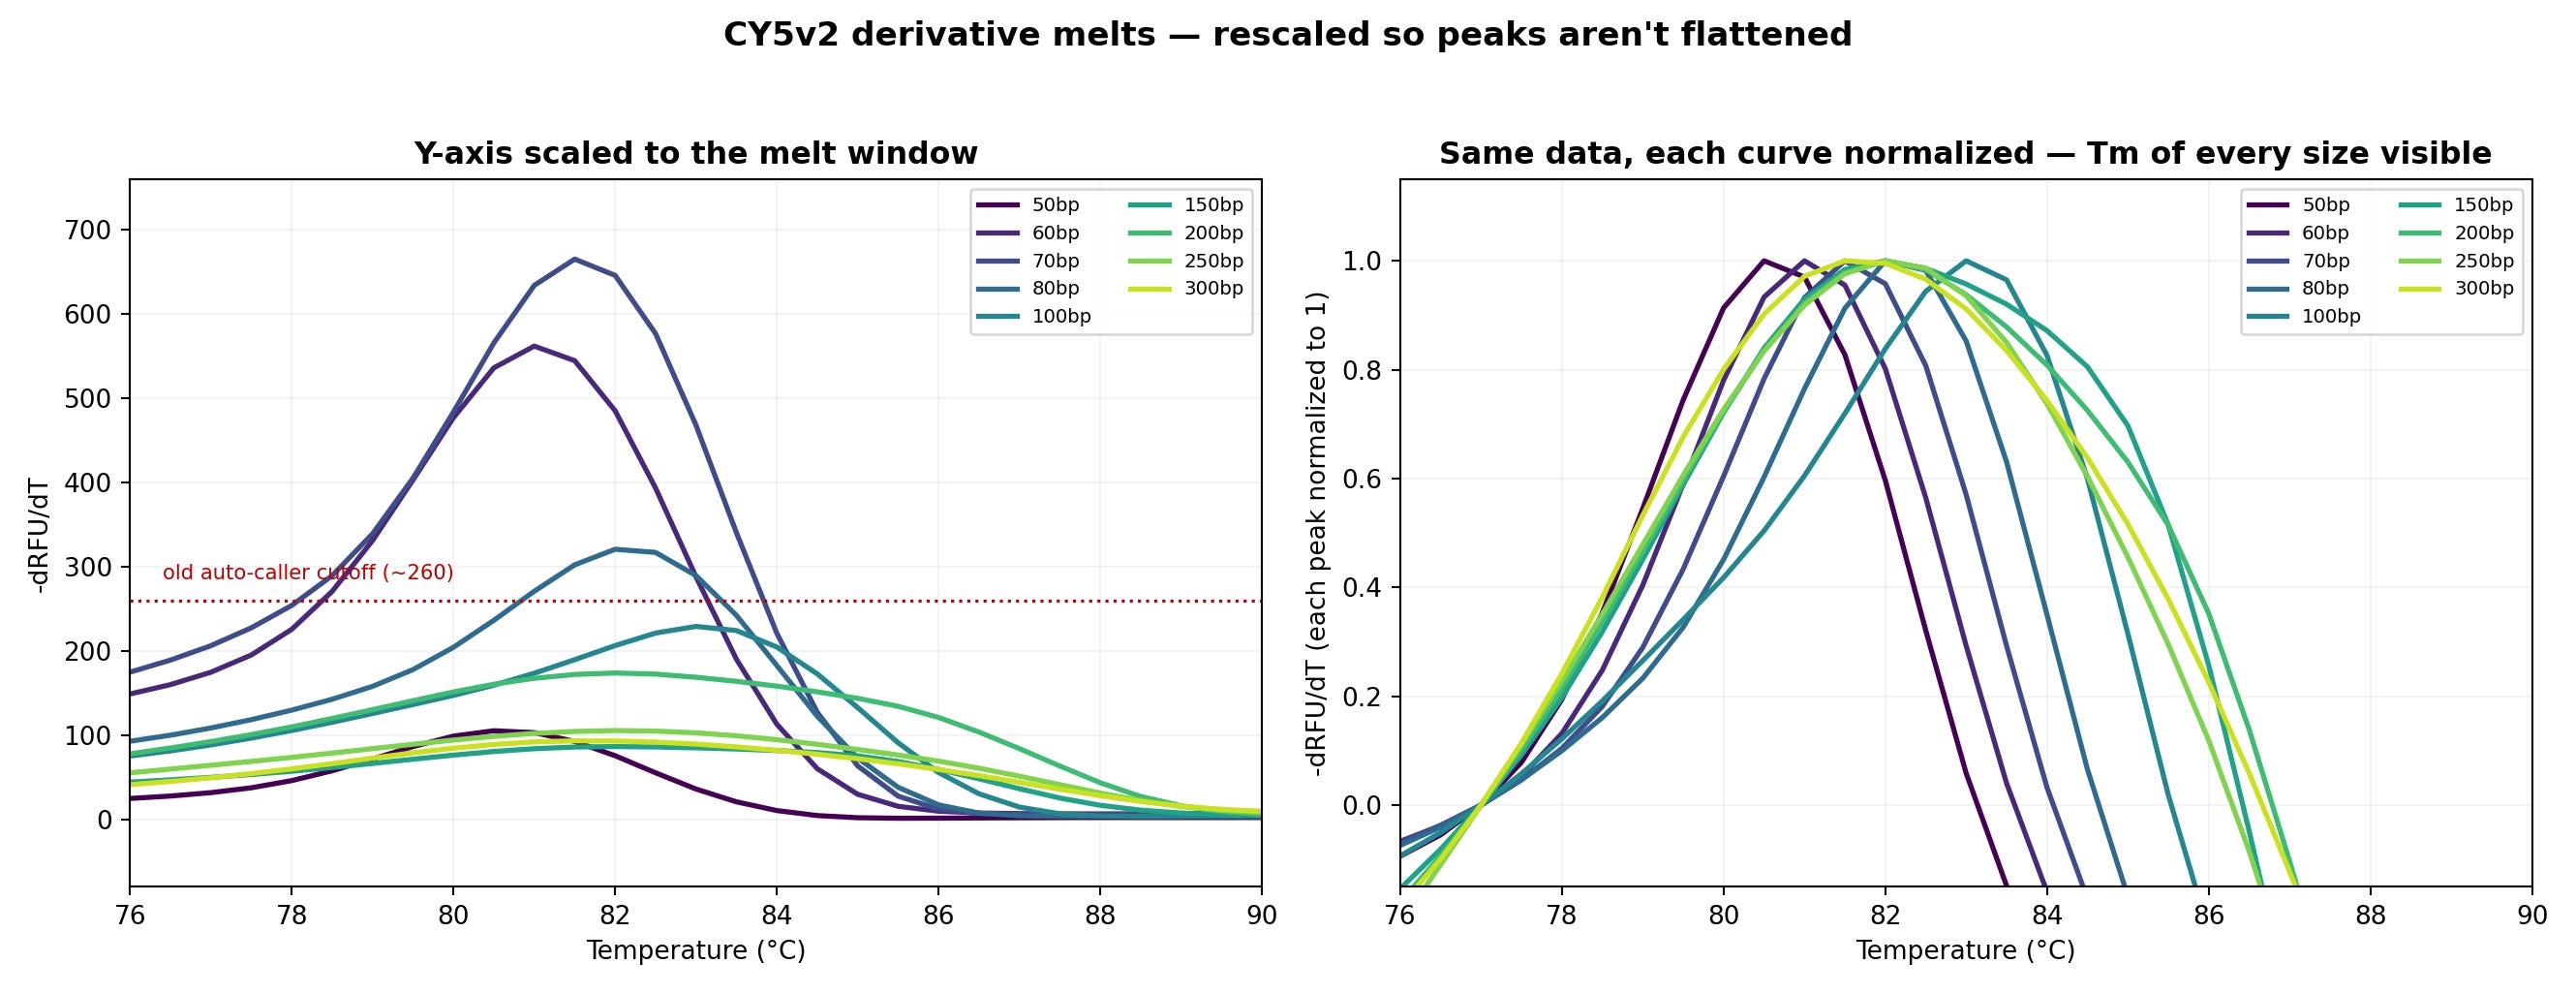
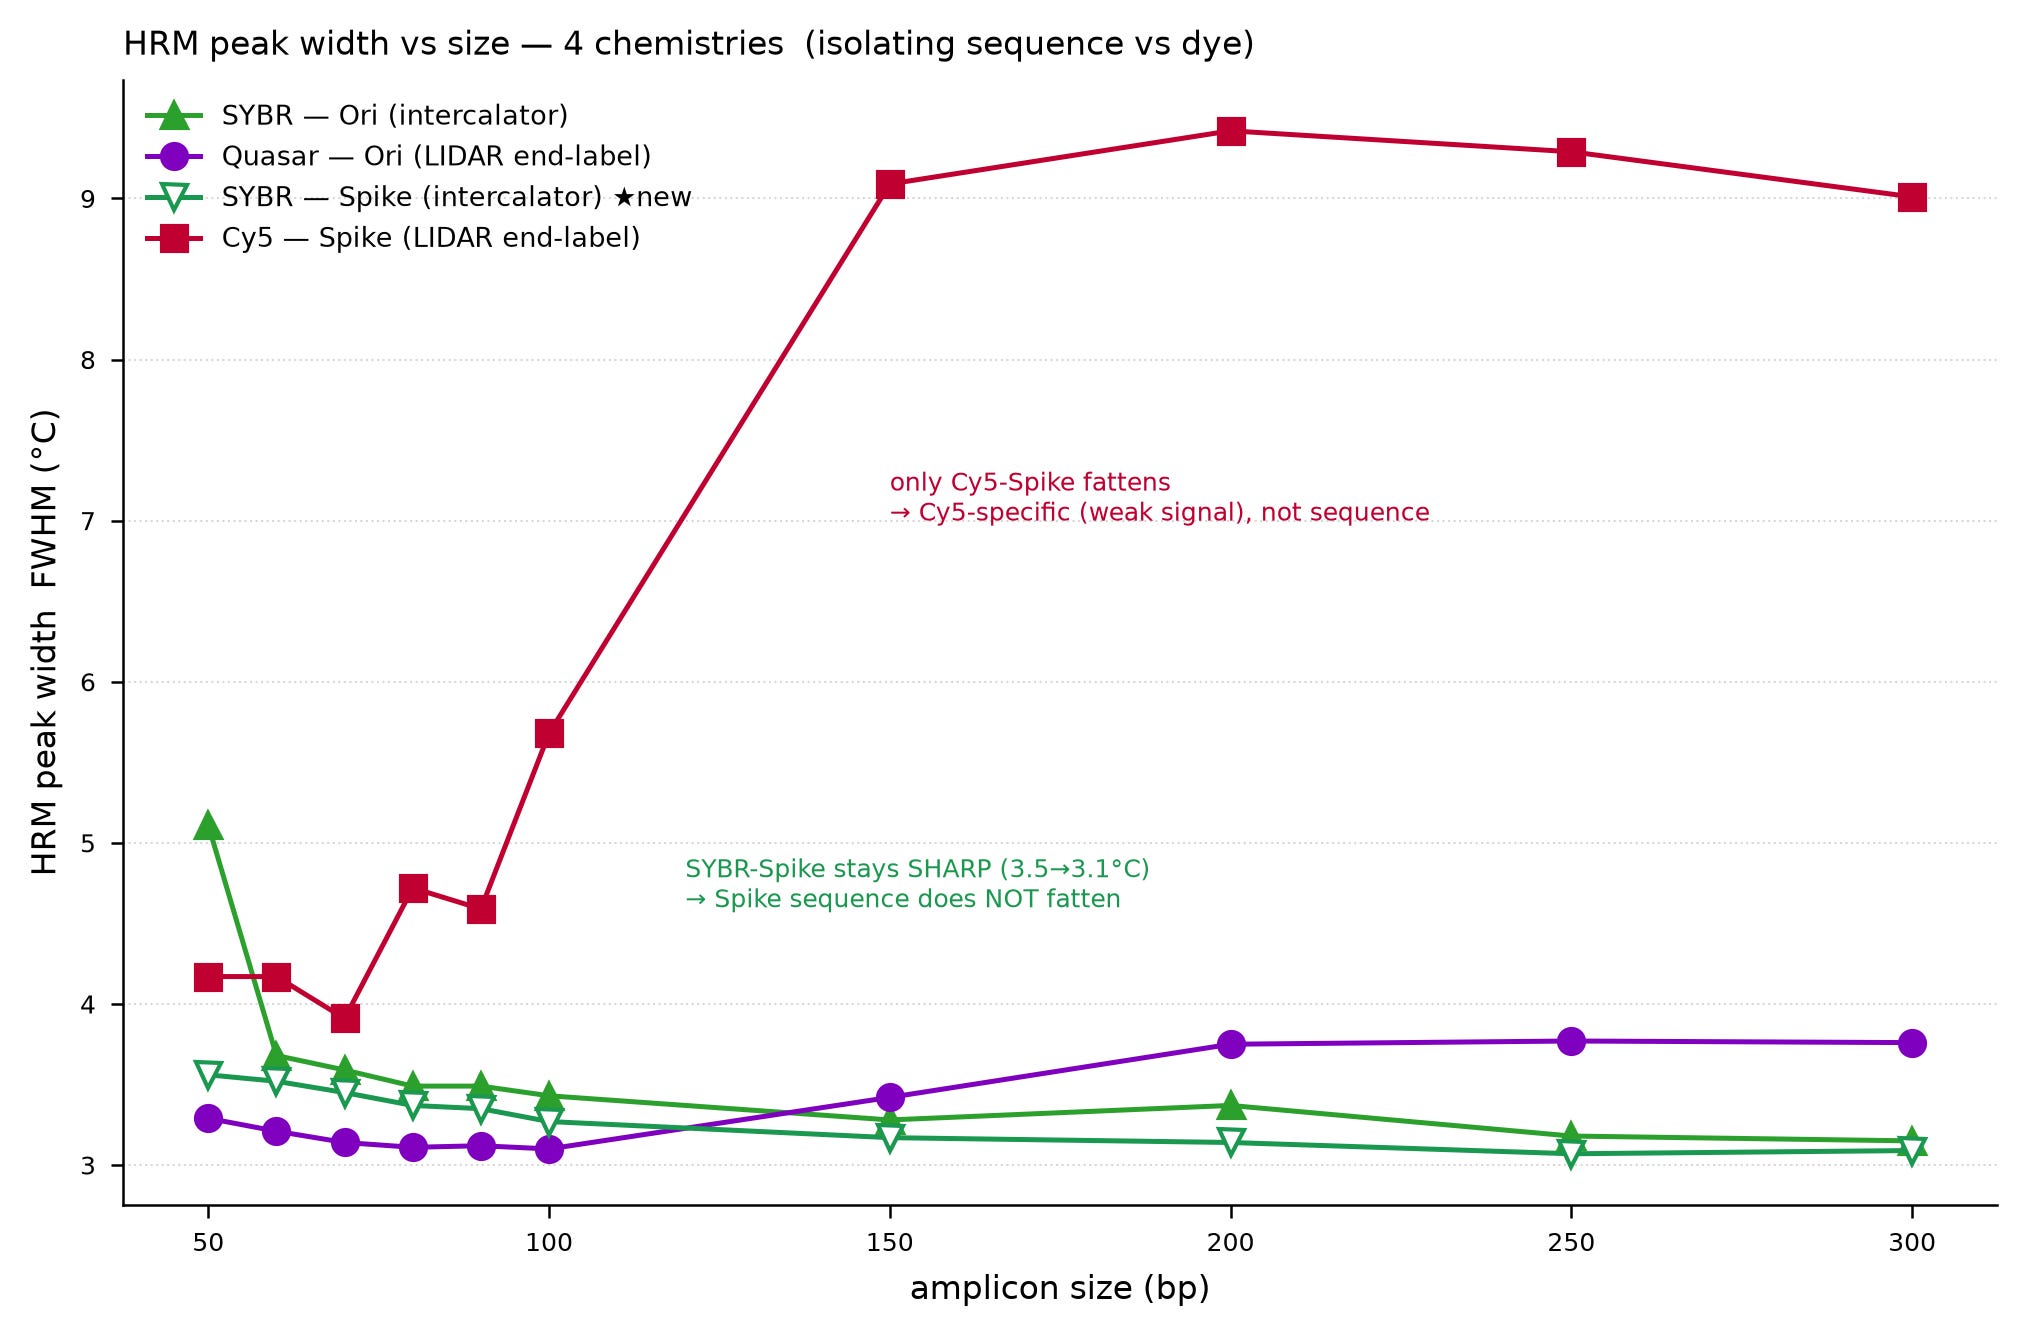
You’ll notice the HRMs agree with SYBR for amplicons under 150bp. They depart due to a 70% GC knot at base 120 in the spike amplicons.
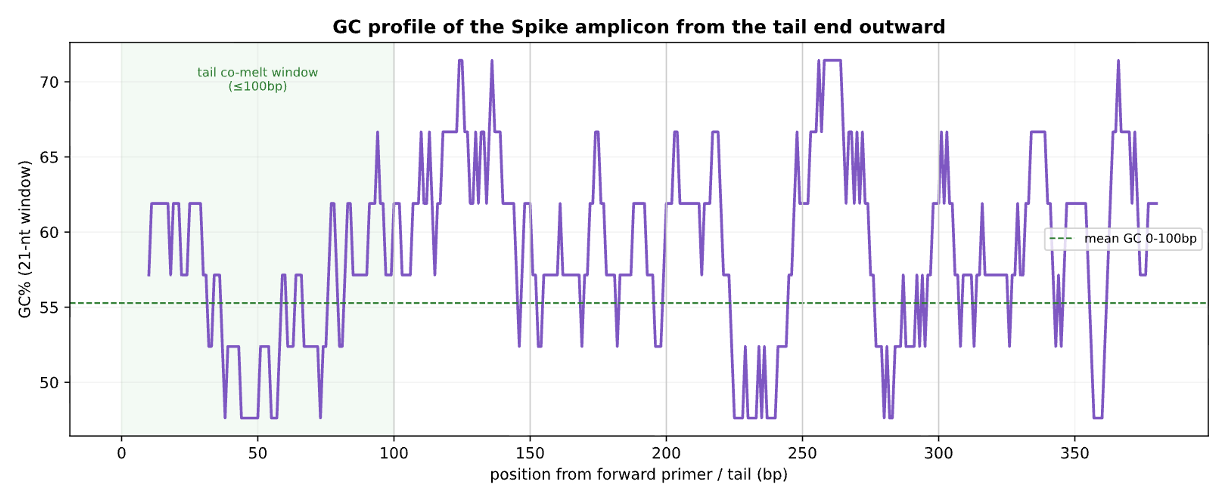
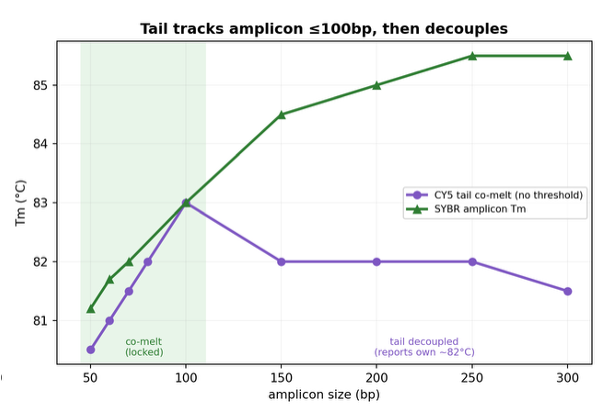
That artifact is actually very informative for LIDAR as we can get Left of Knot (LOK) and Right of Knot (ROK) melting temps for each amplicon if we label the LIDAR reactions from both ends with different colors. SYBR Green cannot do this. It will always report the average Tm of the molecule where LIDAR can show Left vs Right melting temps (Tms) for long amplicons and provide more sequence context information. Below is a LIDAR HRM using Quasar on the Ori amplicon set.
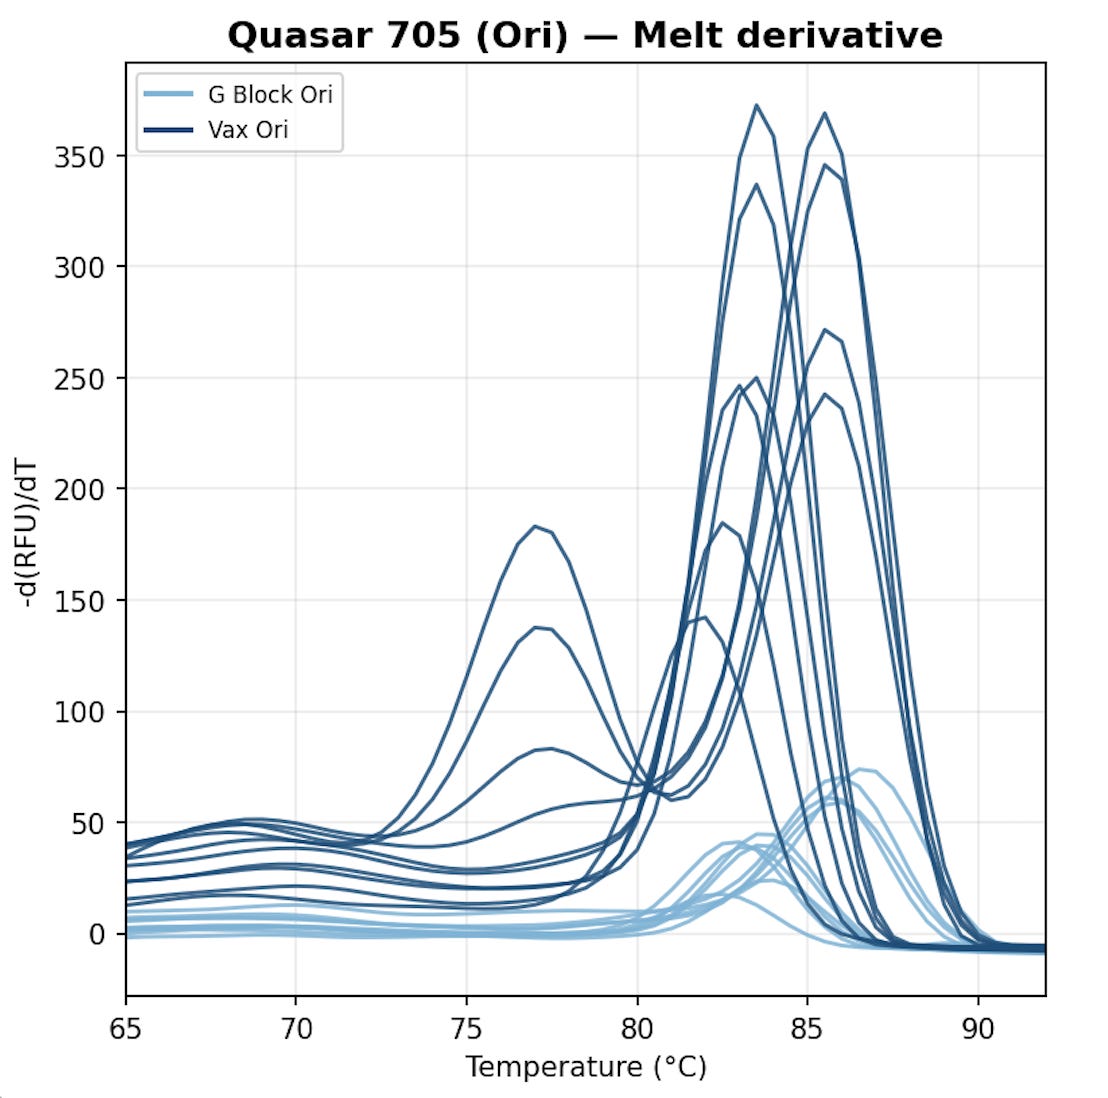
You will note the Quasar Prober is giving more concordant HRMs with SYBR than the Cy5 prober if you simply look at Full Width at Half maximum. This is a measurement of how ‘Fat’ the melt derivatives look for the longer amplicons.
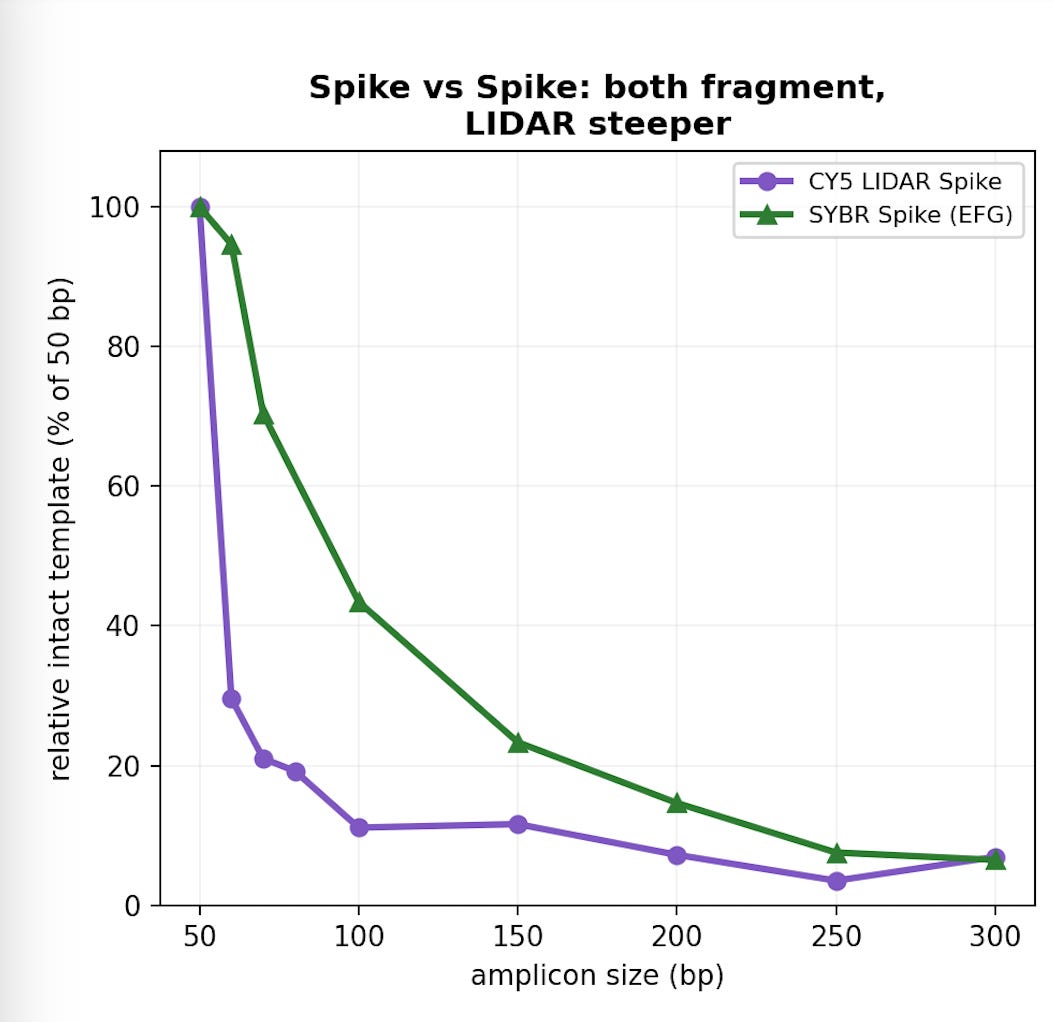
When you chart the fragmentation size as measured with both SYBR Green and LIDAR you will notice SYBR slightly inflates the longer DNA compared to LIDAR. However, both assays demonstrate that the quantitation can vary by over an order of magnitude just by making your qPCR amplicons longer.
This plagued the Ach’s paper which attempted, but failed to debunk the Speicher paper due to several methodological biases in their assays including erratically sized qPCR amplicons.
The below chart shows the estimated DNA in the vaccine using differently sized amplicons with SYBR green vs LIDAR. You will notice LIDAR estimates more of the DNA to be smaller than SYBR due to this photophysics effect and SYBR inflates the quants for the larger amplicons due to multiple dyes being recruited to the larger amplicons and overcounting their numbers. This emphasizes that Taqman assays over 100bp will only capture 10% of the DNA compared to 50-60bp amplicons. Hence the Qubit vs Taqman debate is not about the RNA cross staining with PicoGreen. Speicher and McKernan et al both used RNaseA to remove RNA, yet this critique continues to circulate while the photophysics of the detection tools is actually one of the 16-32 fold mechanisms at play. The second mechanism at play was already published in the Journal of Independent Medicine. This second mechanism (RNA:DNA hybrids) has a larger impact (6CTs or 100 fold) and is also published by BioNtech scientists. DNaseI doesn’t process RNA shielded DNA and one can see a 100 fold more DNA in spike than in the KAN region.
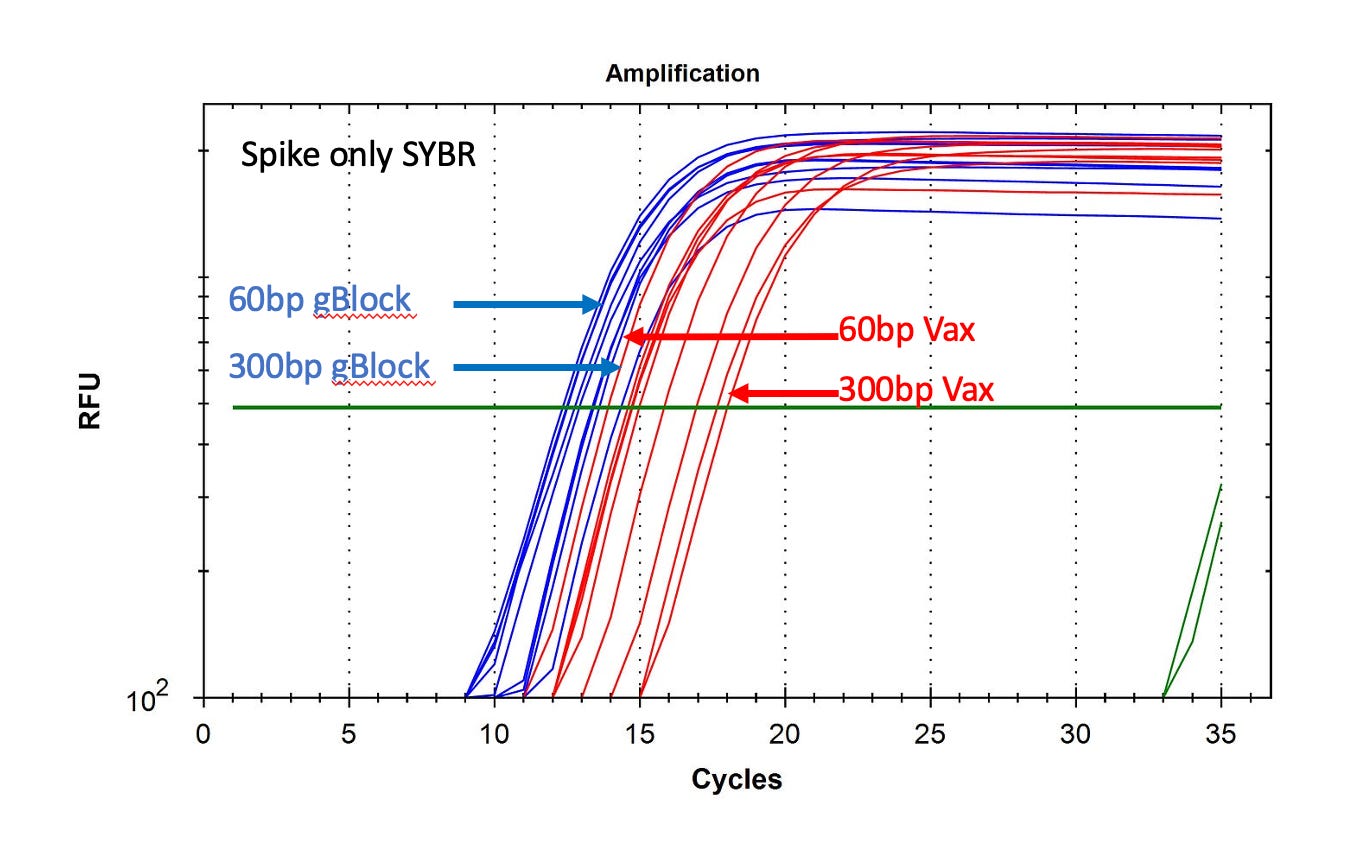
We continued this exploration on amplicons arrays using synthetic DNA controls which are not fragmented like the vaccine. We looked at both 300bp synthetic controls and 400bp synthetic controls as there is some literature in the field that priming DNA on the termini of CT rich DNA can suffer poor hybridization when primed flush to the termini of the template. The 400bp synthetic DNA is designed to control for this artifact and we do indeed see slightly different results from a few of the terminal amplicons.
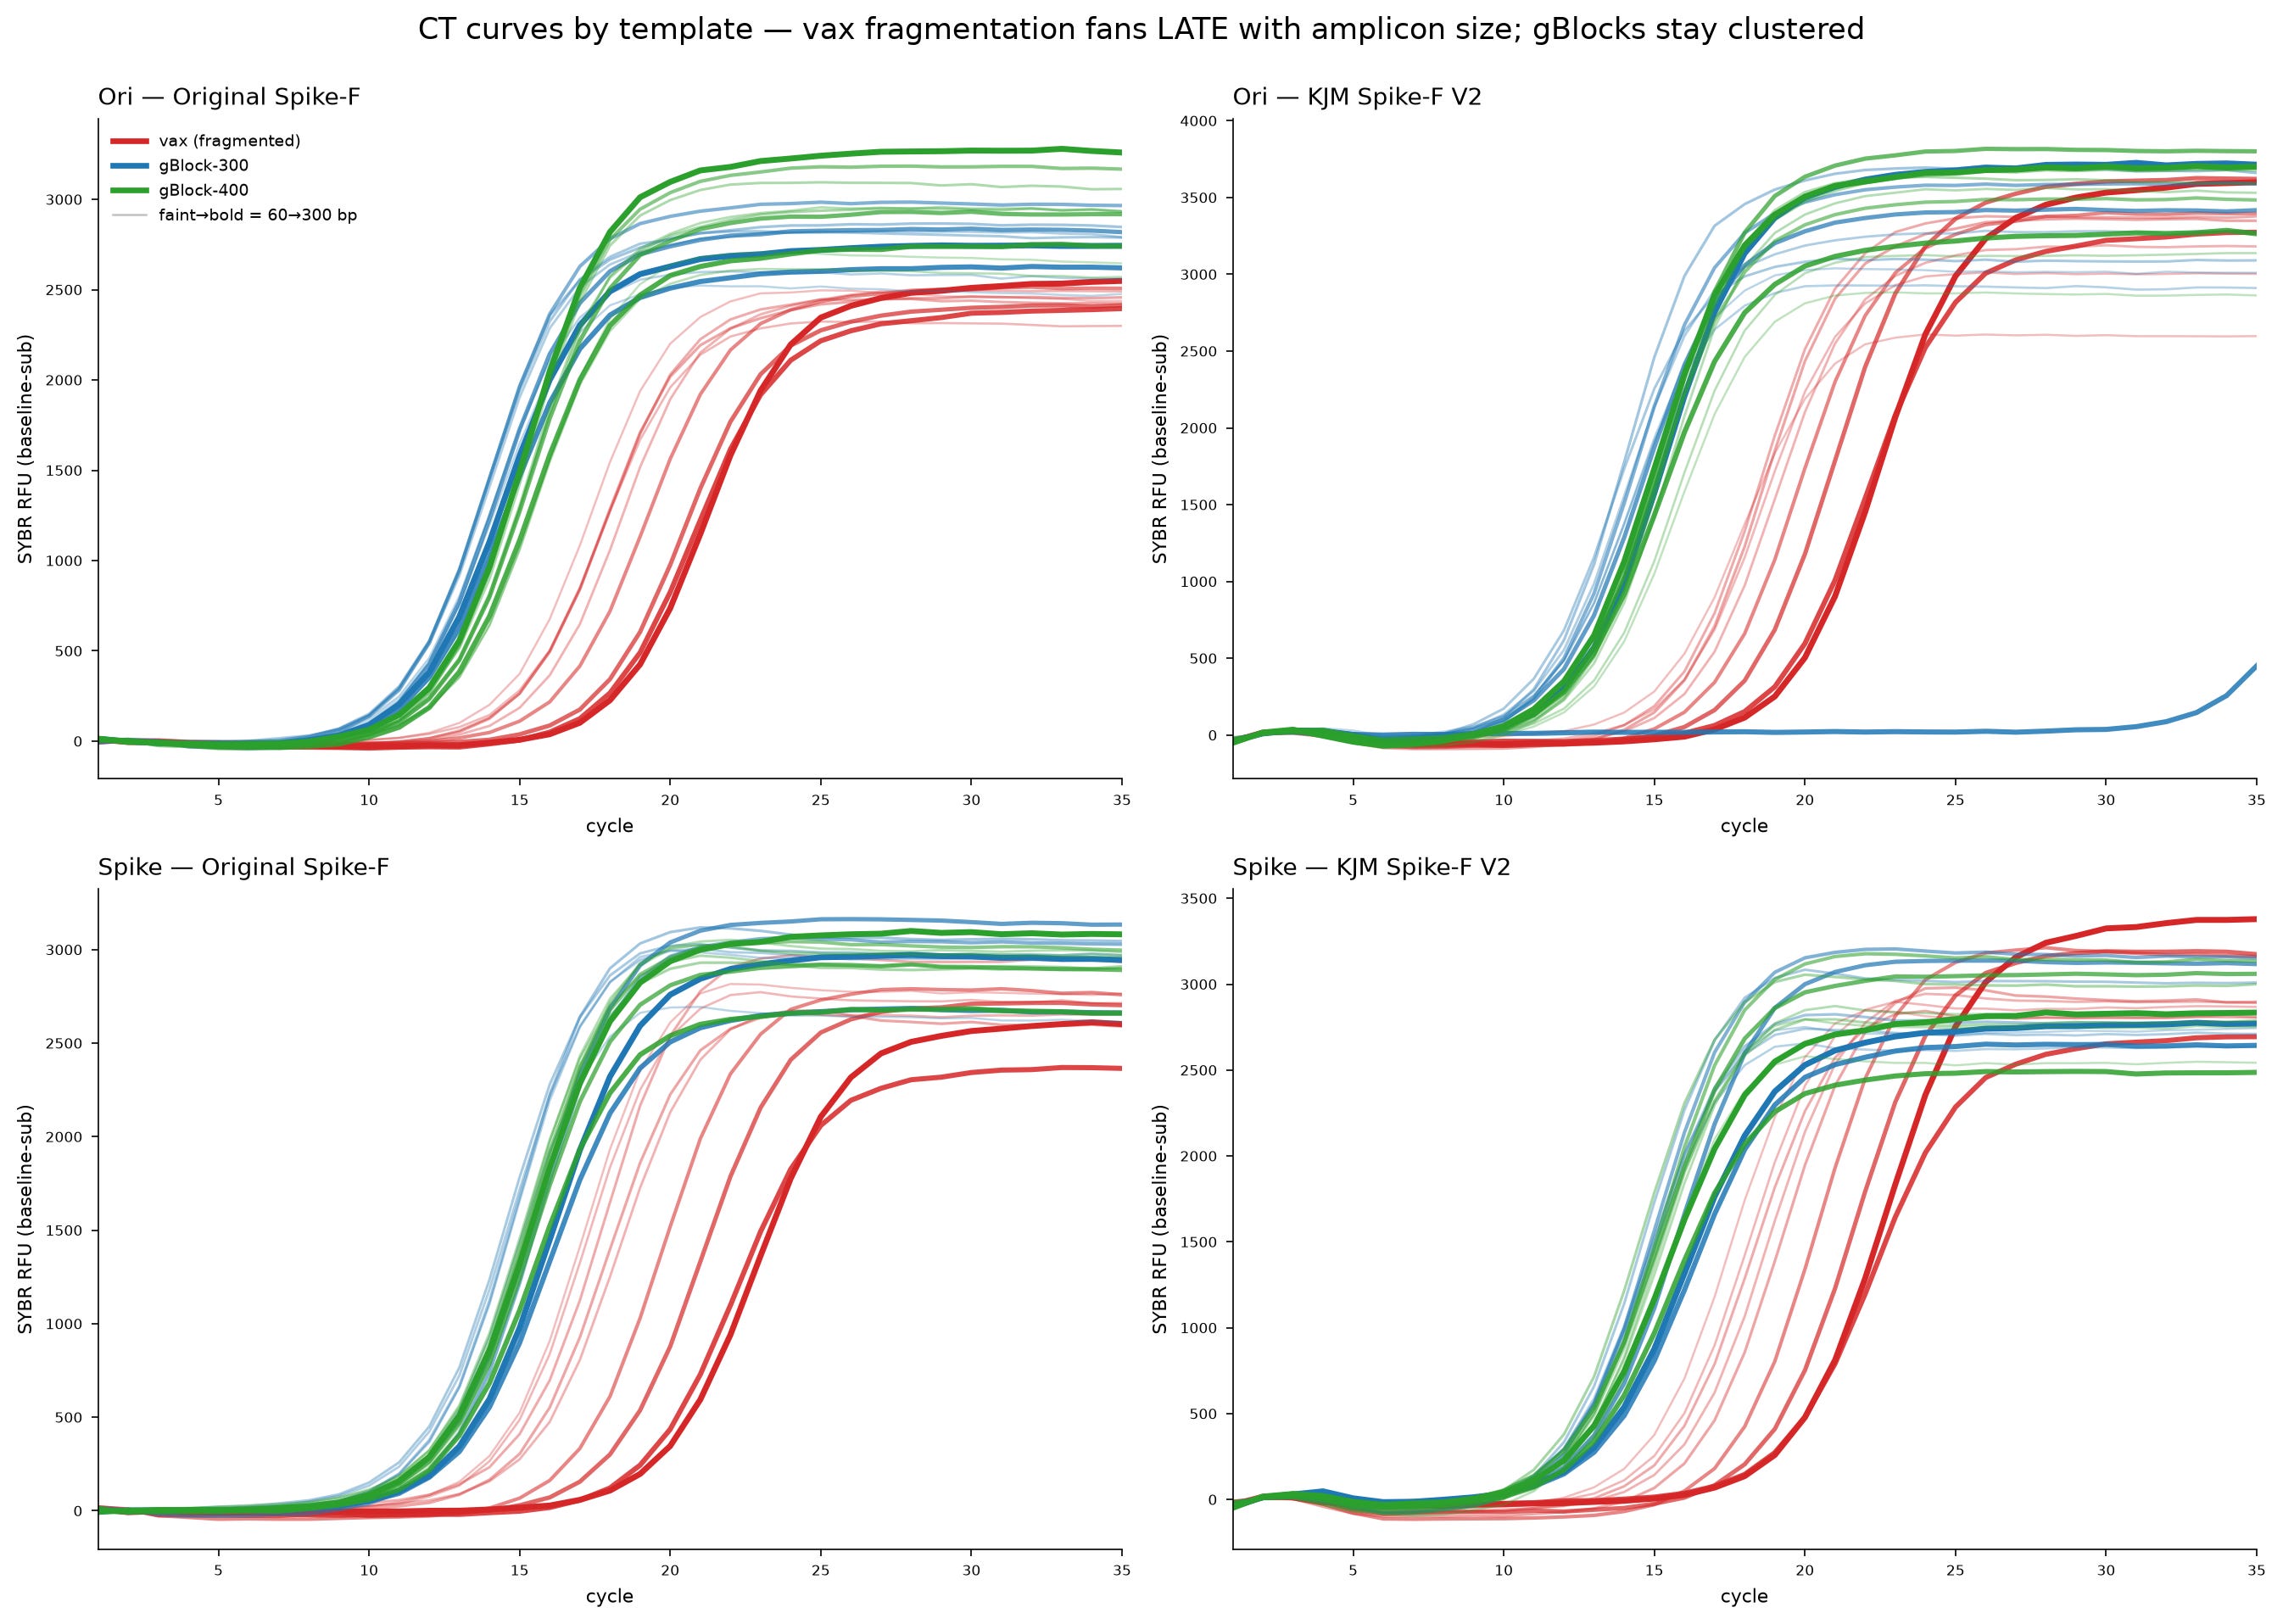
The gBlocks are contiguous synthetic DNA made by IDT. These have no fragmentation so every molecule in the reaction is full length. These are in Blue and Green. You will note, regardless of the size of the amplicons we get similar CTs although the amplitude of the signal can be altered by SYBR green as larger fragments provide more dye. The Red lines are the SYBR PCR of the vaccine and you can see a notable increase in CT as the amplicons get larger. The lighter Red lines are the smaller amplicons and the darker red lines represent the larger amplicons.
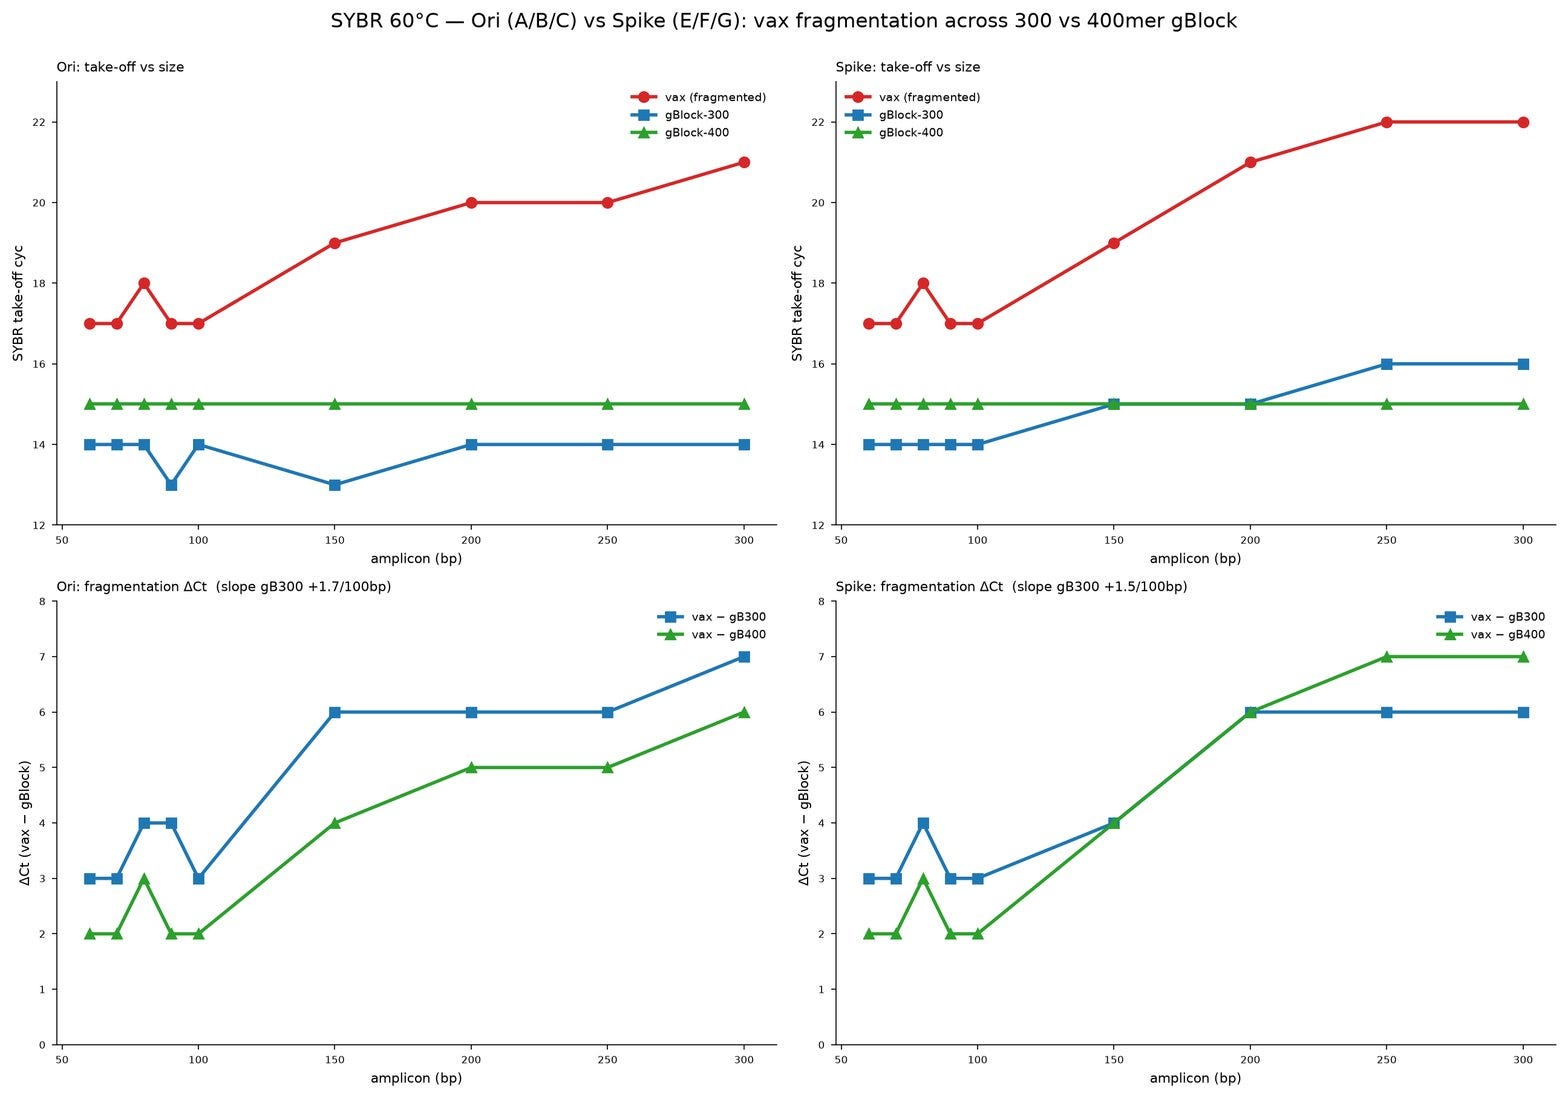
There are some subtle differences priming the spike amplicon gBlock termini due to some CT context at the termini of those fragments. This artifact is resolved when longer synthetic DNA is present and our primers are not trying to hybridize to termini without flanks. This is a very subtle detail in hybridization kinetics required for peer review but it is worth disclosing. There is a thermodynamic tax hybridizing to the flush end of some CT sequences that doesn’t occur if the DNA target has flanking sequence.
If you run these amplicon arrays using LIDAR with a Quasar tailed Forward primer for Ori you get a similar clustering of CTs for short amplicons with some delays for the longer amplicons on gBlocks. These larger amplicon CT delays mostly disappear on the 400bp gBlocks but are still delayed compared to SYBR Green versions of these assays (yellow curves on lower right chart). We believe this is due to the photophysics effects described earlier. A curious eye will see a later CT (14 SYBR vs 16 LIDAR) on the smaller amplicons. This delay is related to the 1:100 dilution of the Bridge primer in the LIDAR reactions and doesn’t impact the final quant as the standard curves are run with that same bridge primer dilution.
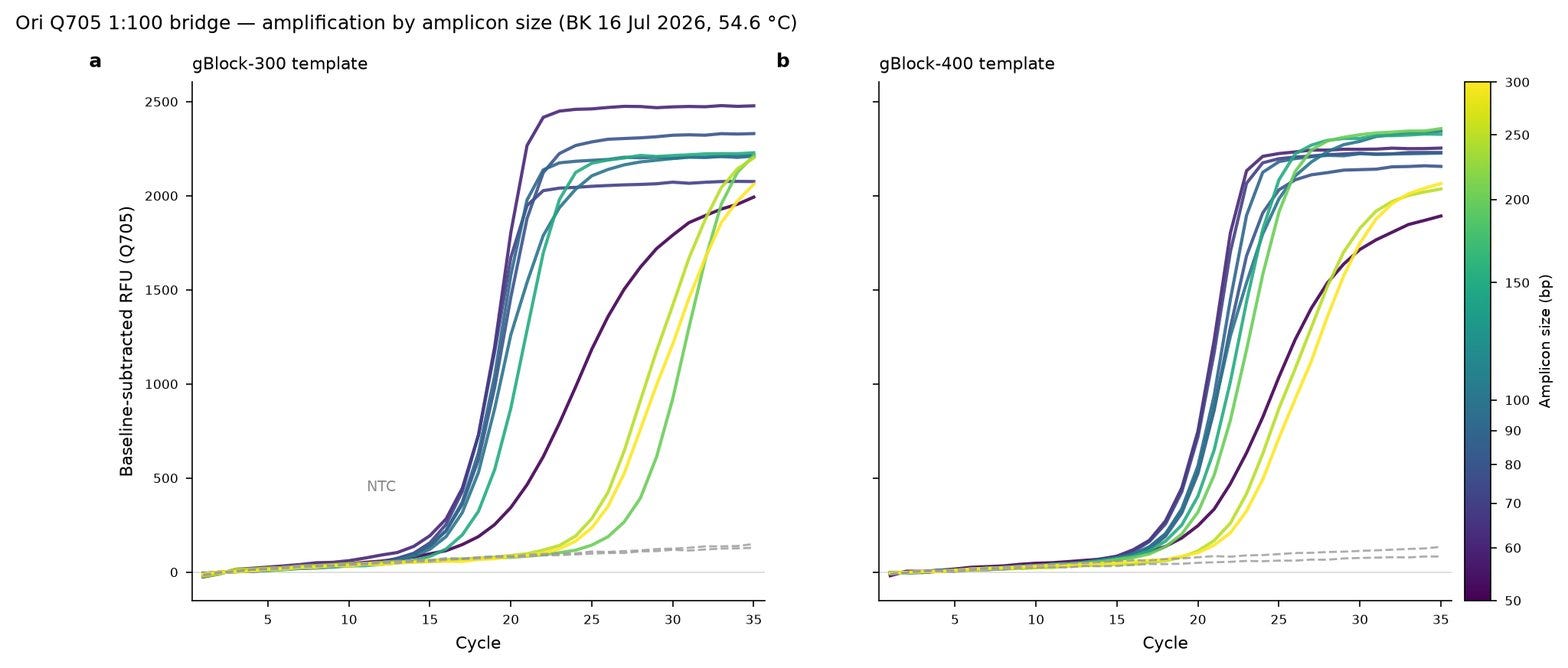
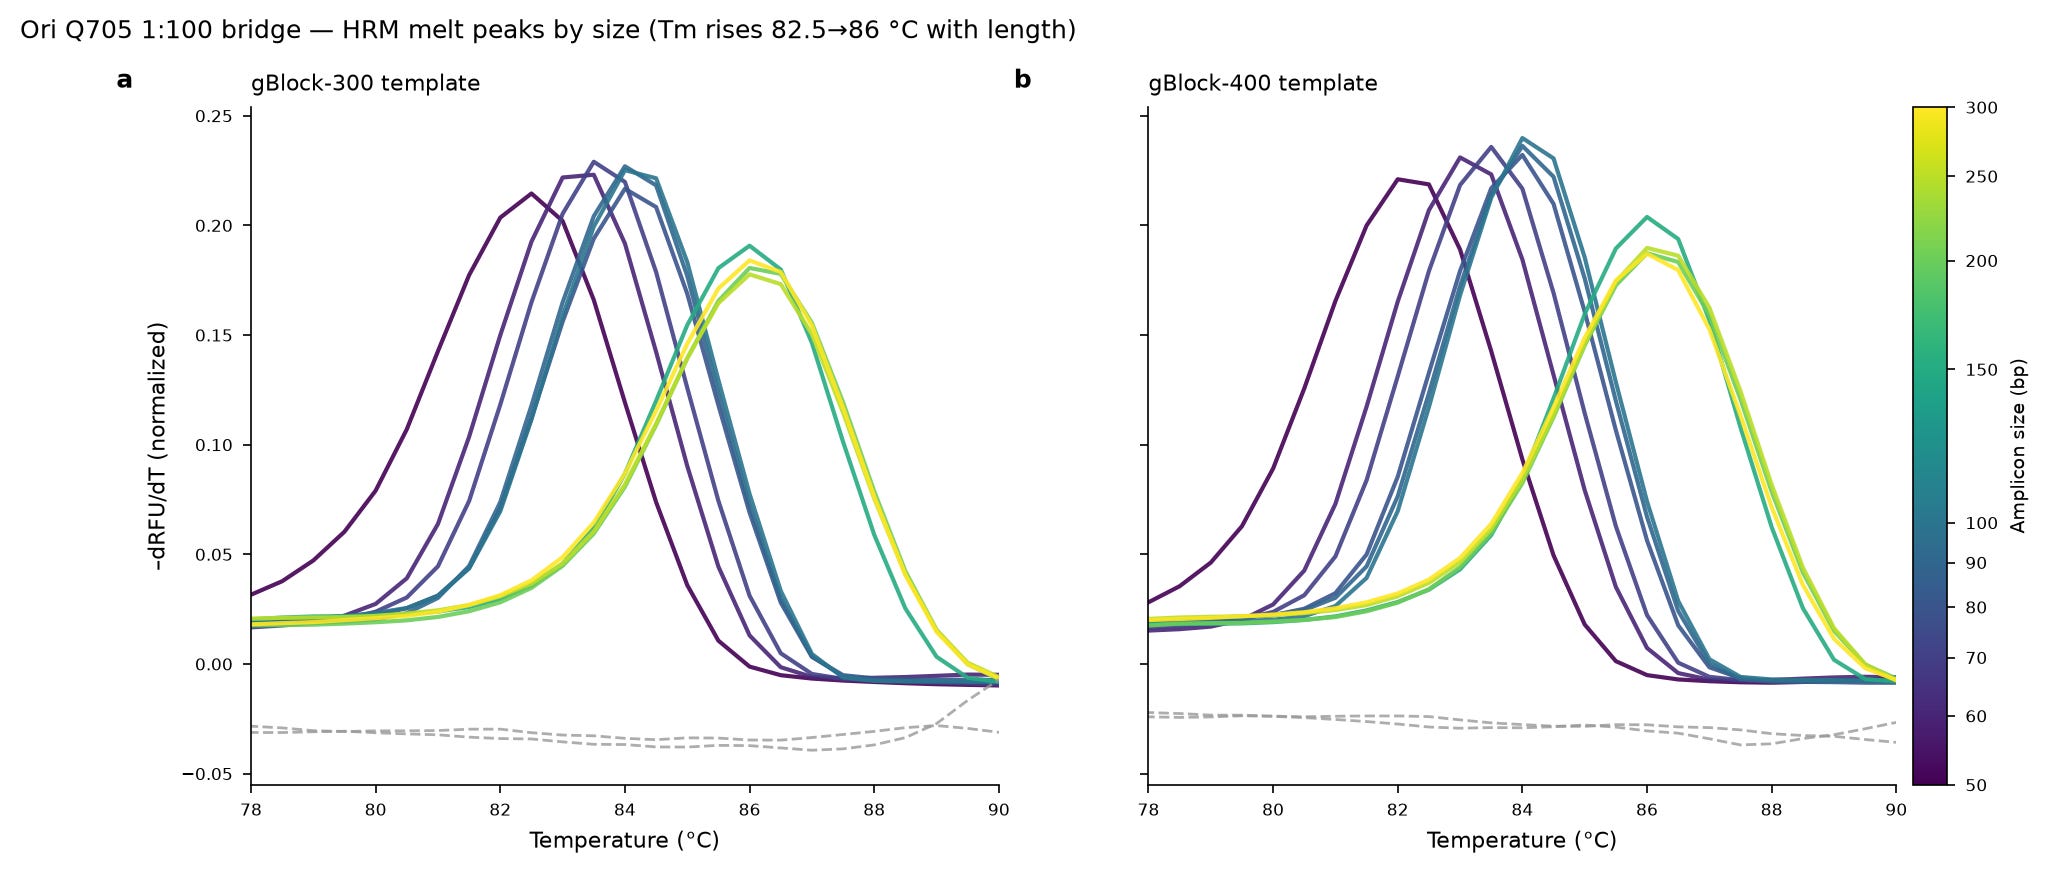
This bridge primer delay is the cost of using universal tails but can be mitigated if you link your species specific primer to the prober in synthesis but then you are back to the economics of Taqman probe synthesis.
This bridge primer delay is an artifact of unlabeled Bridge primer concentration and doesn’t impact final CT→DNA concentration assessments when the same bridge primers are used in your standard curves. Both reactions have a similar CT offset and the quant remains accurate. LIDAR can be run without bridge primers but you forfeit the use of universal reporters and are back to the same expense as Taqman where a F-Q probe or prober must be uniquely synthesized for every target.
At this point, most people question how sensitive is LIDAR next to Taqman? In our experience, LIDAR usually shows up 2CTs earlier than Taqman when probers are synthesized with a species specific 3’ end (No Bridge priming).
This is due to LIDAR labelling the 1st step of PCR while Taqman is a 2nd order proxy for amplification. Signal generation in Taqman is dependent on 3 steps.
First, a primer must extend. 2nd a Probe must hybridize to the primer synthesized DNA and this process is not 100% efficient. 3rd, Flap Endonuclease activity (5→3 exo) must engage and hydrolyze the probe and this is the slowest activity of the polymerase. So Taqman signal is actually the composite of Hybridization efficiency X FEN1 activity and several steps downstream of the priming event that generates signal in LIDAR.
To further explore LIDARs flexibility, we have amplified Pseudomonas with 5 different LIDAR probers and evaluated their HRMs. We note they all overlap with different colors and the different master-mixes can have a subtle impact on the HRM likely due to Mg2+ or salt differences. Some probers amplify more aggressively than others and their bridge primer concentrations need to be optimized to balance them all.
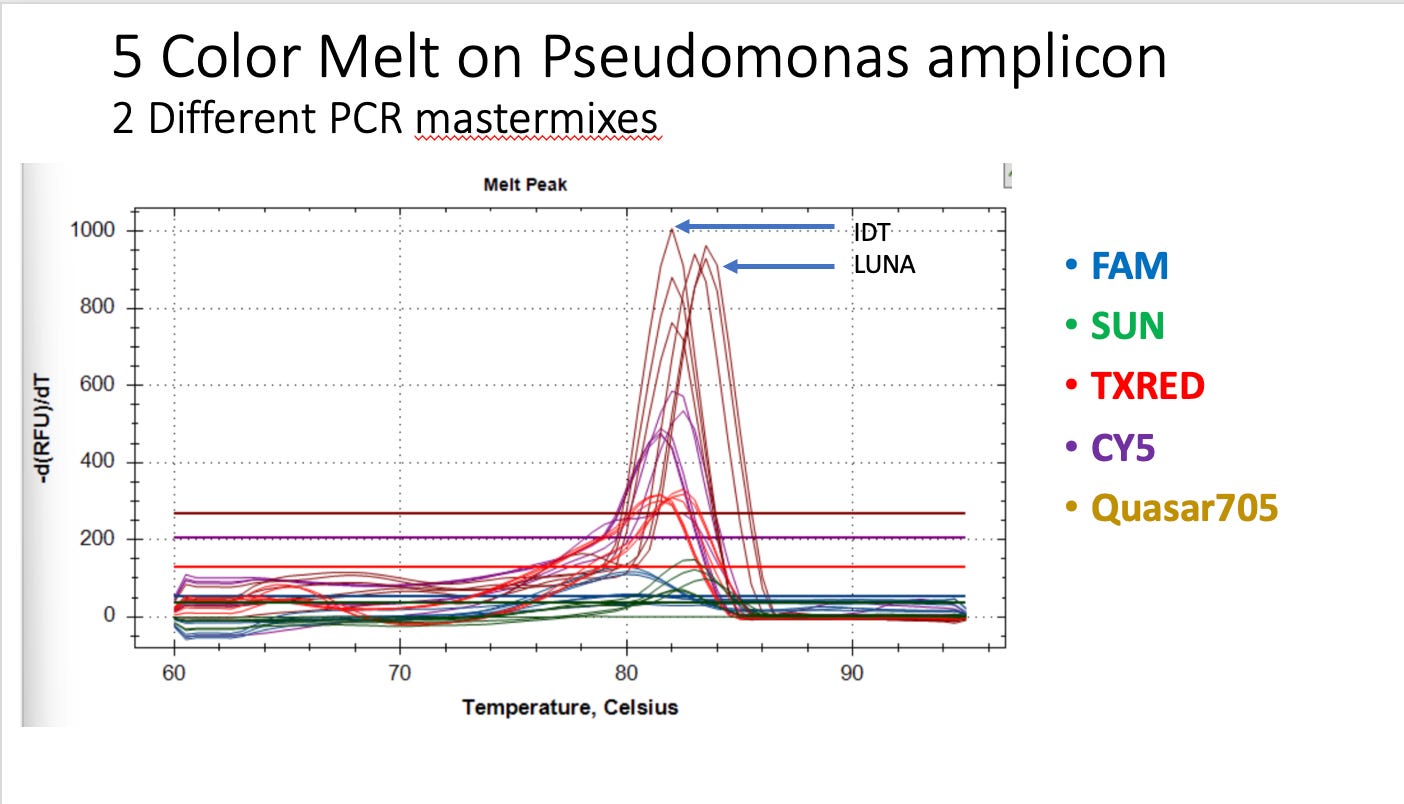
Repeated on 5 different organisms with altered ratios of bridge primers to normalize the different probers.
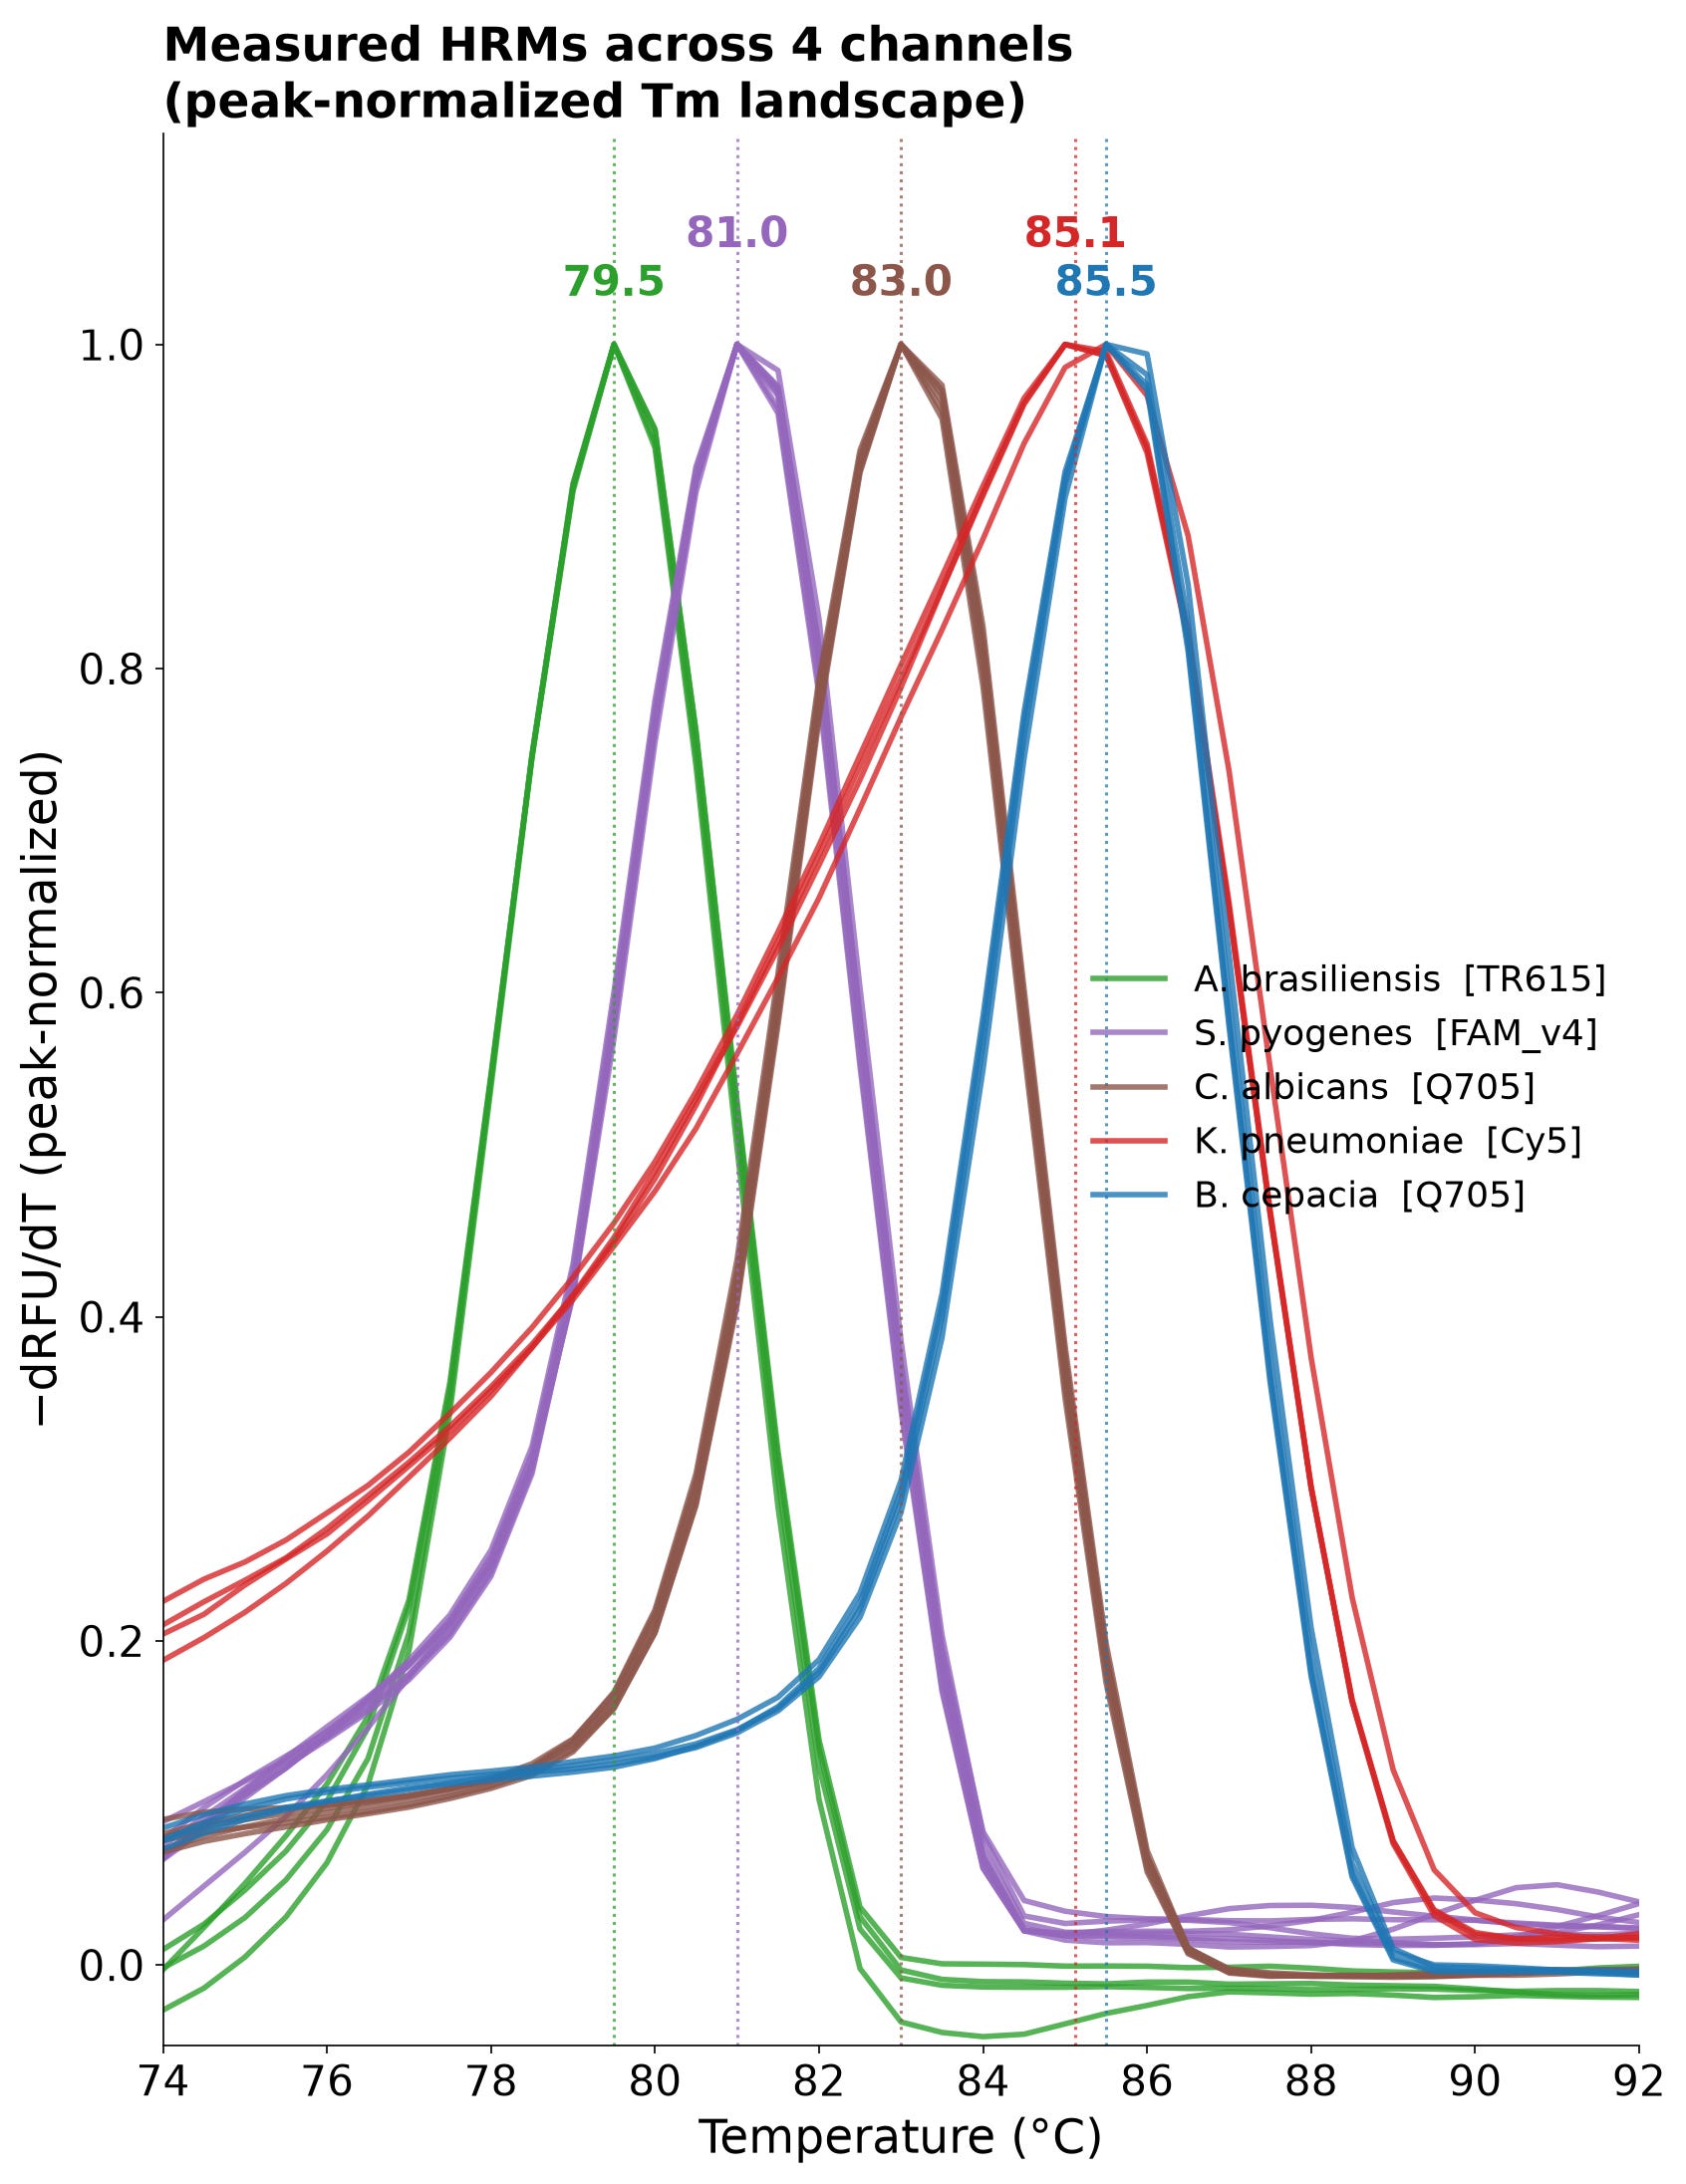
When you flip the probers onto their reverse primers and rerun these HRMs you get additional information.
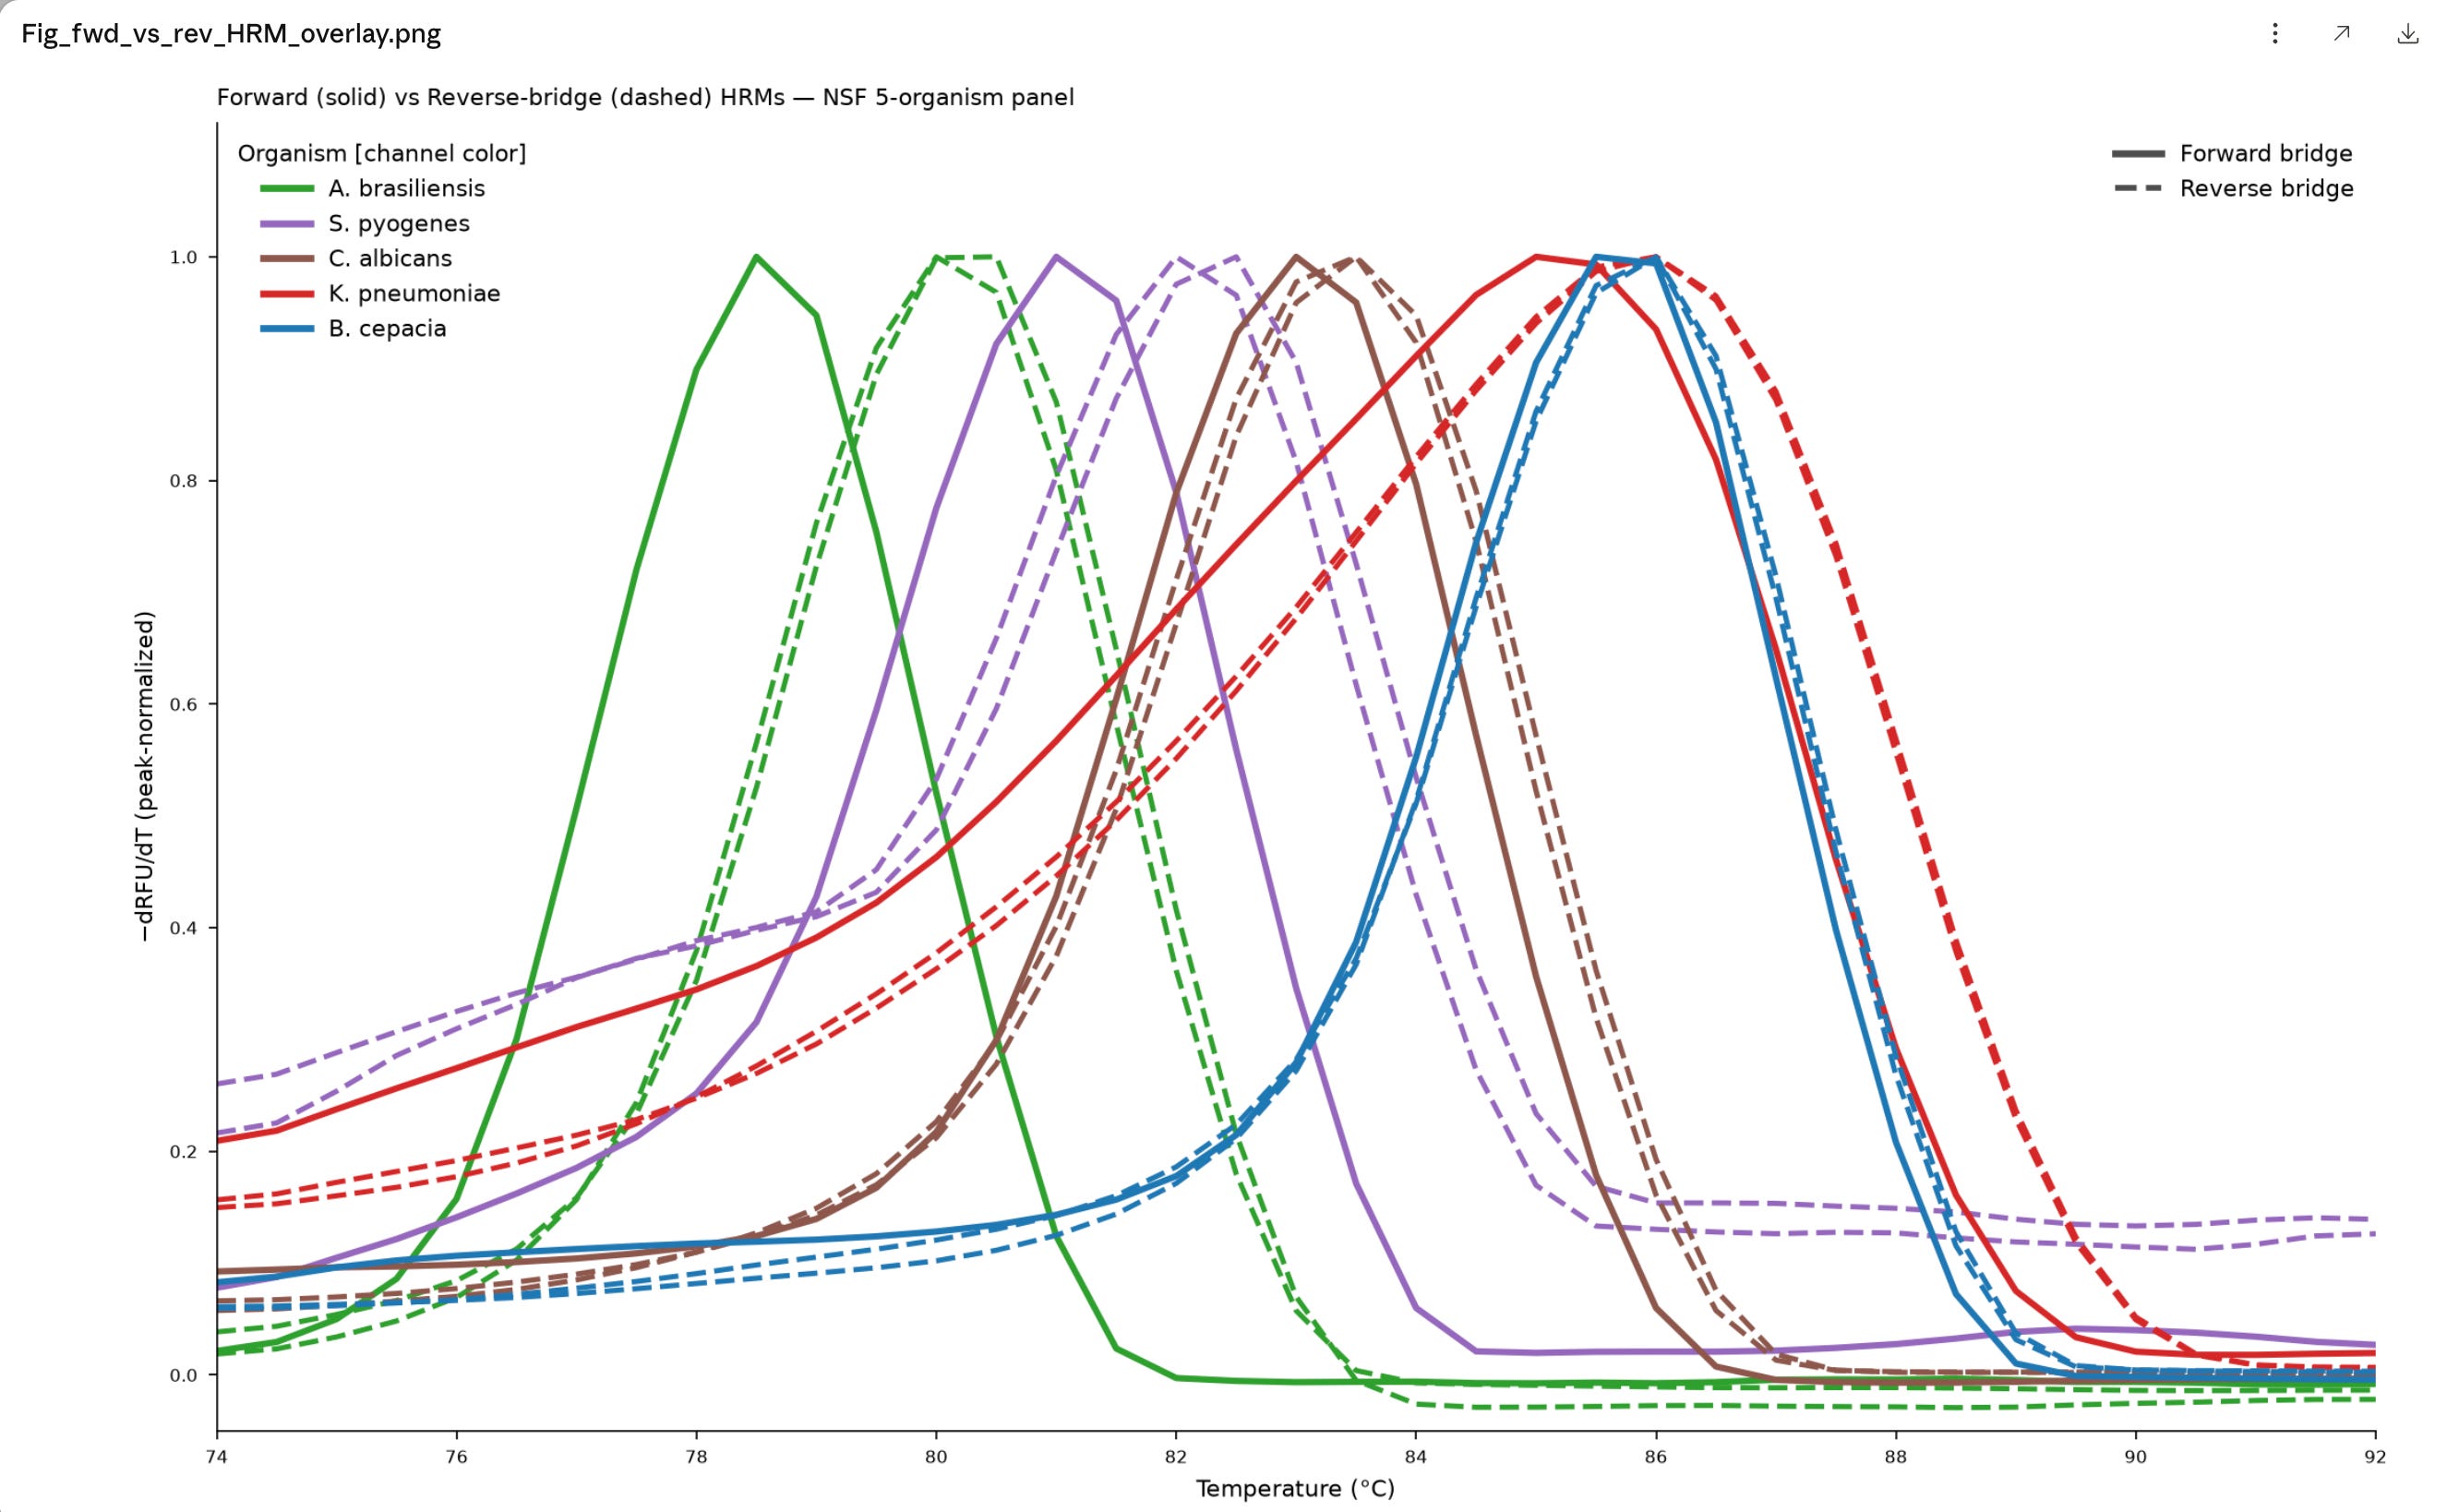
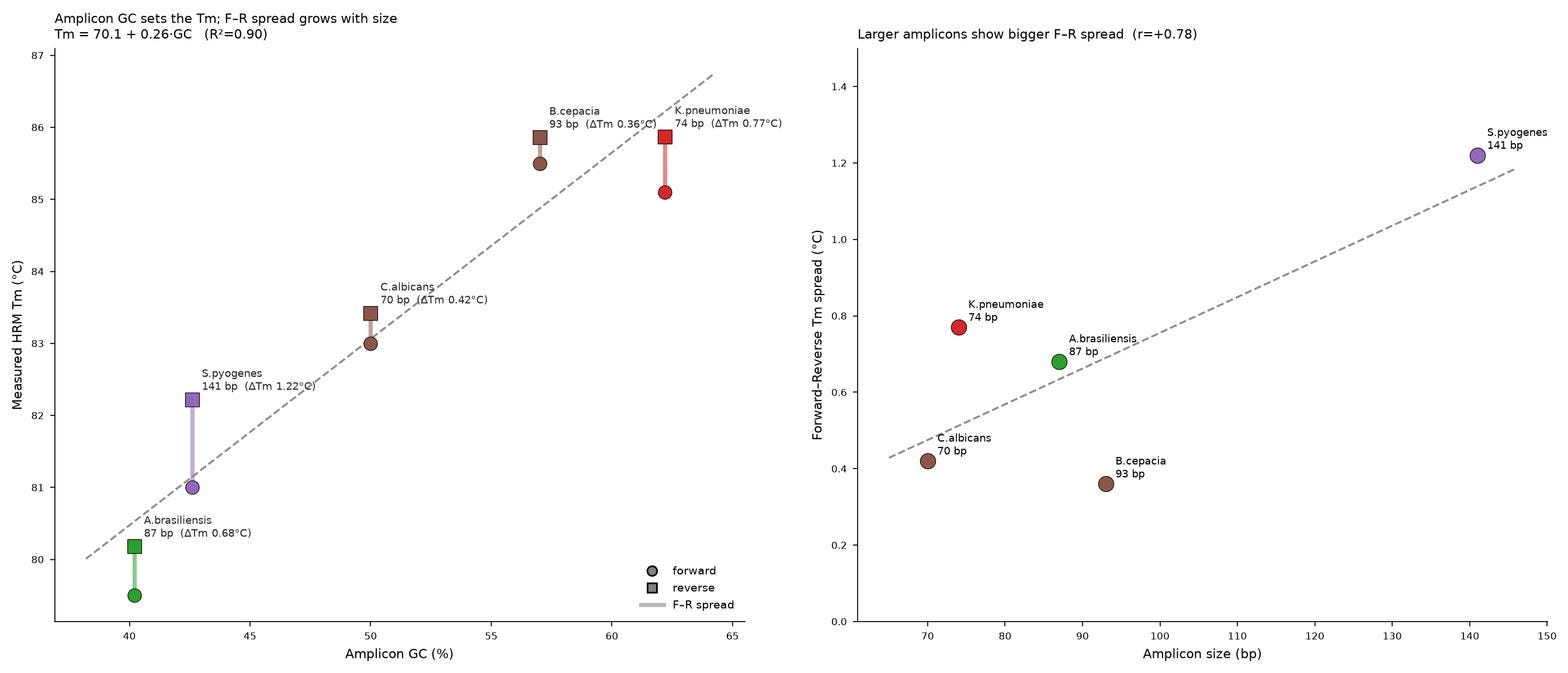
A good way to think about LIDAR HRMs is that they are 2D HRMs where the amplicon provides 90% of the melt prediction and the Forward and Reverse orientation of the HRM is an additional 10% contribution to the HRM. Thus you can get additional sequence context information from LIDAR that is averaged into one HRM from SYBR green.
LIDAR is also a more direct readout of the process of PCR compared to Taqman.
When amplifying with CY5 (Pseudo) and FAM (Staph) Taqman probes, we observe amplification curves that plateau at 1750, and 4000 RFUs respectively.
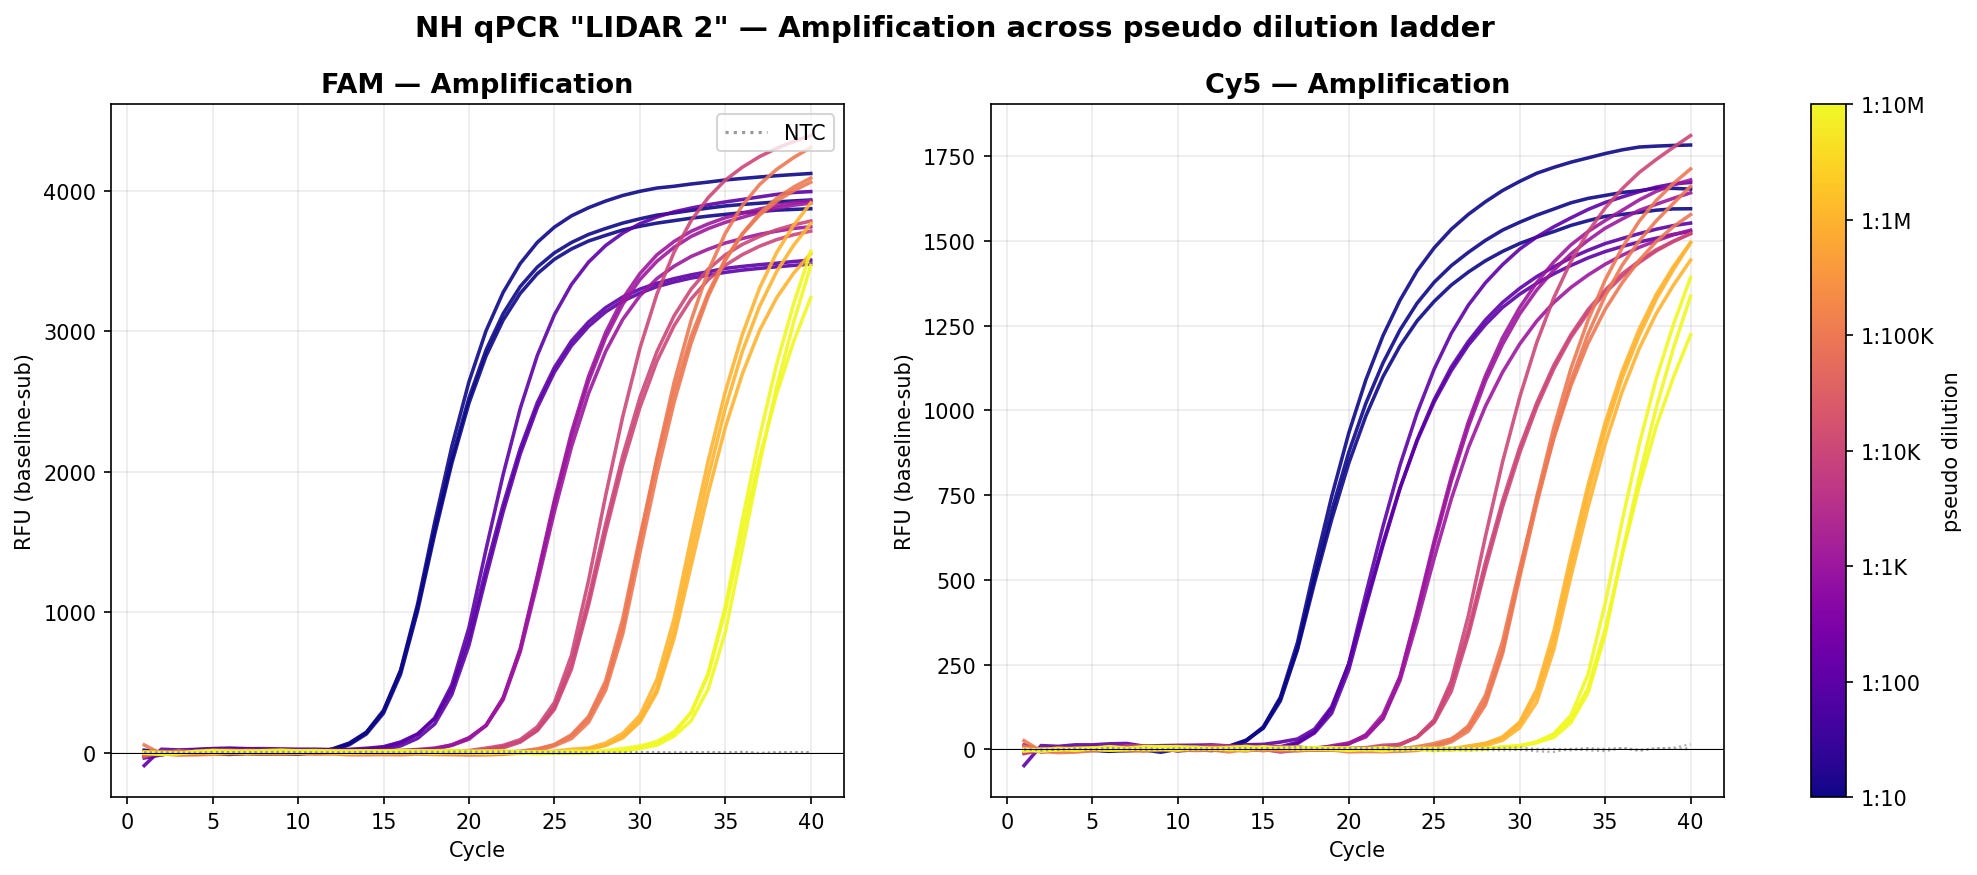
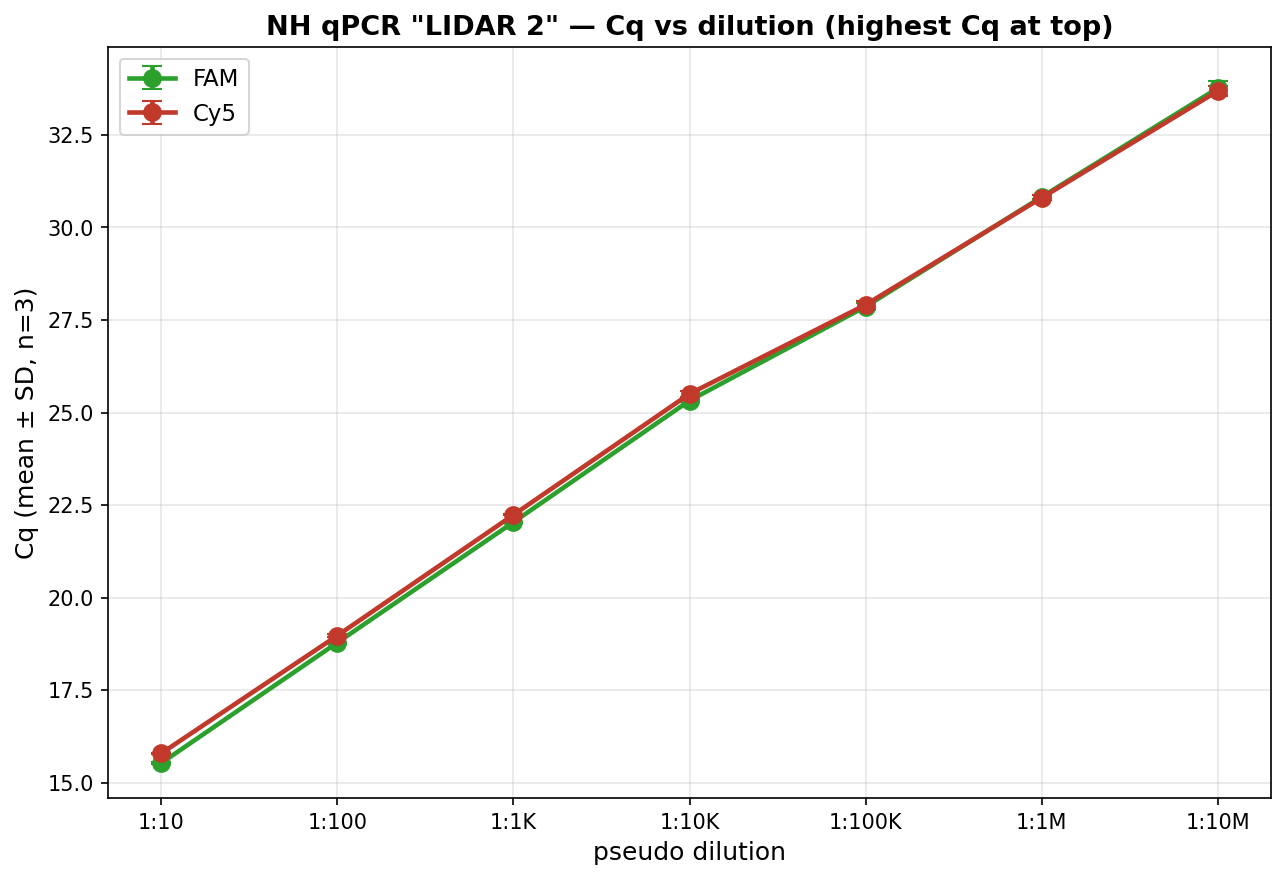
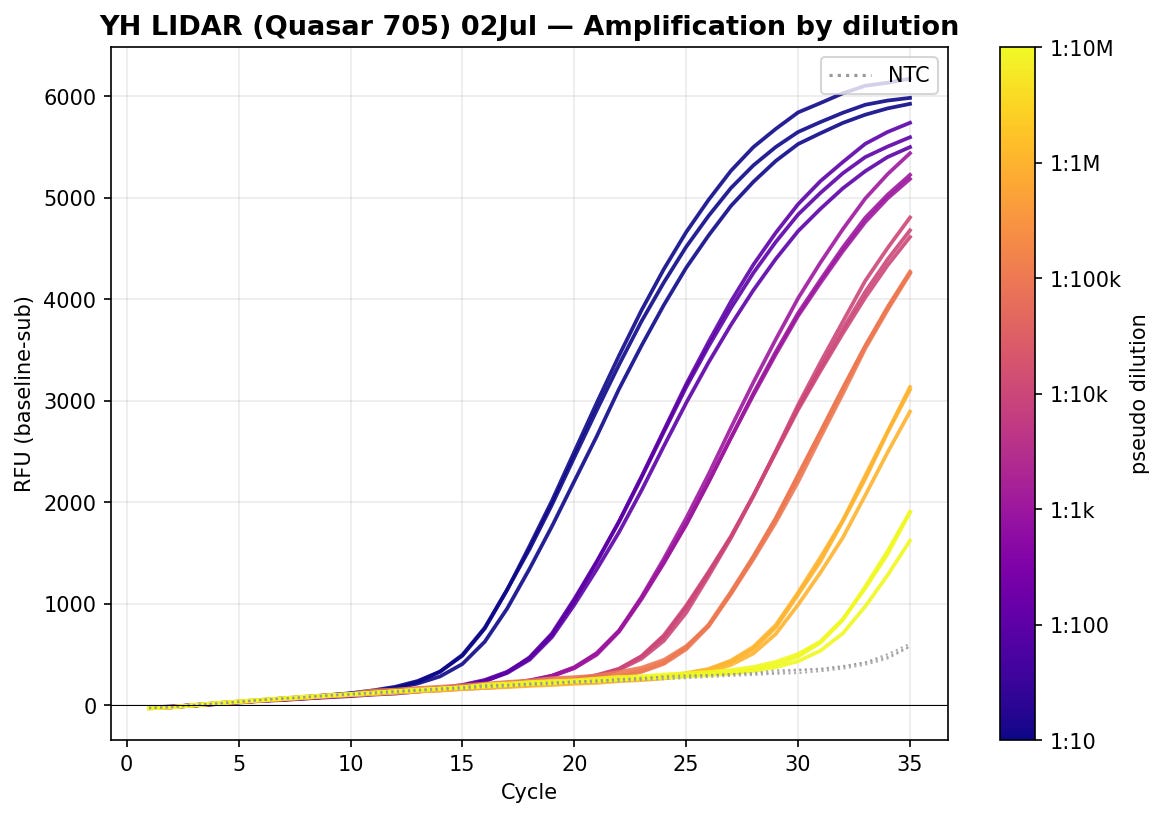
With LIDAR the reaction plateaus around 6,000 with Quasar705 on Pseudomonas. This could be a result of the different Quantum yield of these dyes but in our experience this is common even with the same dye as most Taqman protocols call for using half as much probe as primer. Taqman probes have suboptimal F-Q distances that usually put the Quencher and the Dye 20-25 bases apart and this leads to partial quenching and high background when equimolar amounts of primer and probe are used so the general rule of thumb is 2X less probe than primer and you pay for it with lower signal amplification compared to when your primers are your reporters (as in LIDAR).
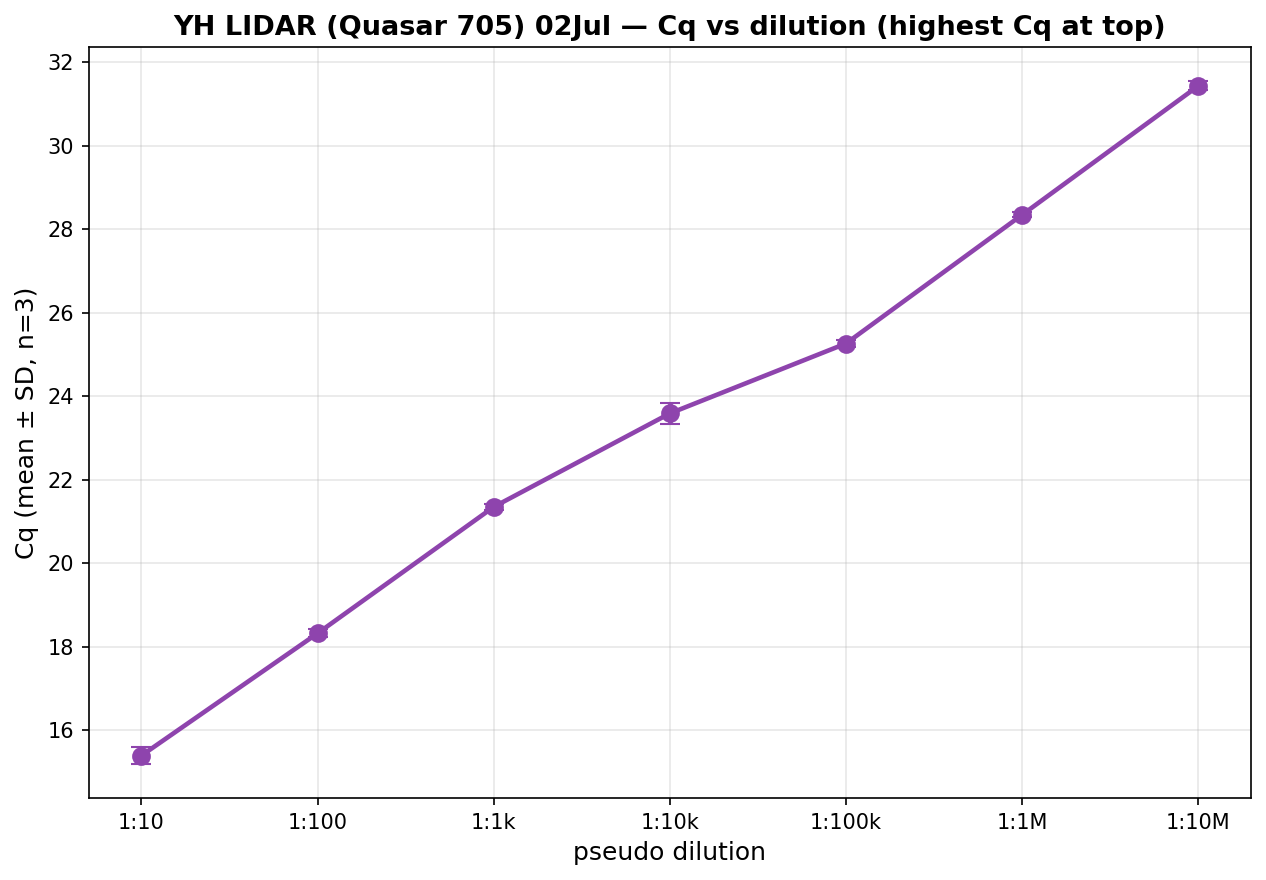
Below is a serial dilution of Pseudomonas amplification showing quantitative linearity with LIDAR and a slightly earlier CT call than Taqman.
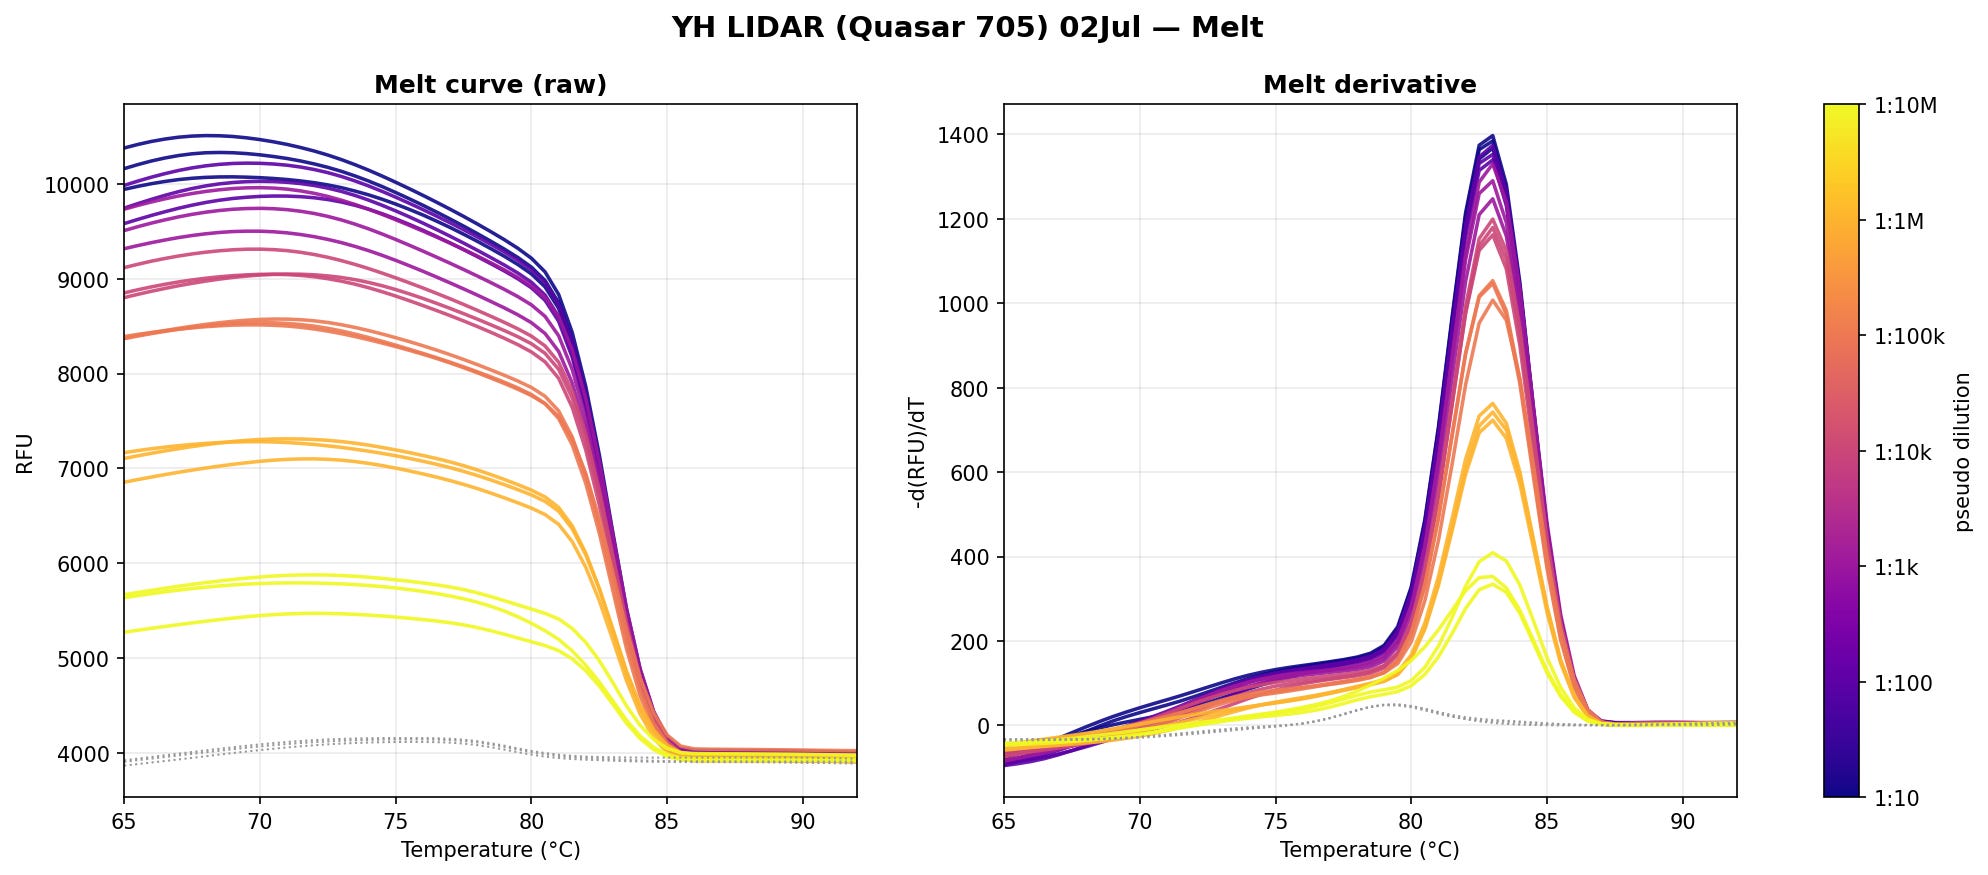
Unlike Taqman, sharp HRMs are obtained after amplification, verifying the target amplified. You will note that the HRM amplitude is reflective of the end point PCR yield. This is another dimension of LIDAR that can be leveraged. More on that later.
In our experience, the comparison of LIDAR vs Taqman performance is a bake off that fails to leverage their combined strengths. The fact that Taqman dequenches differently than LIDAR can be further leveraged over using any one technique in isolation.
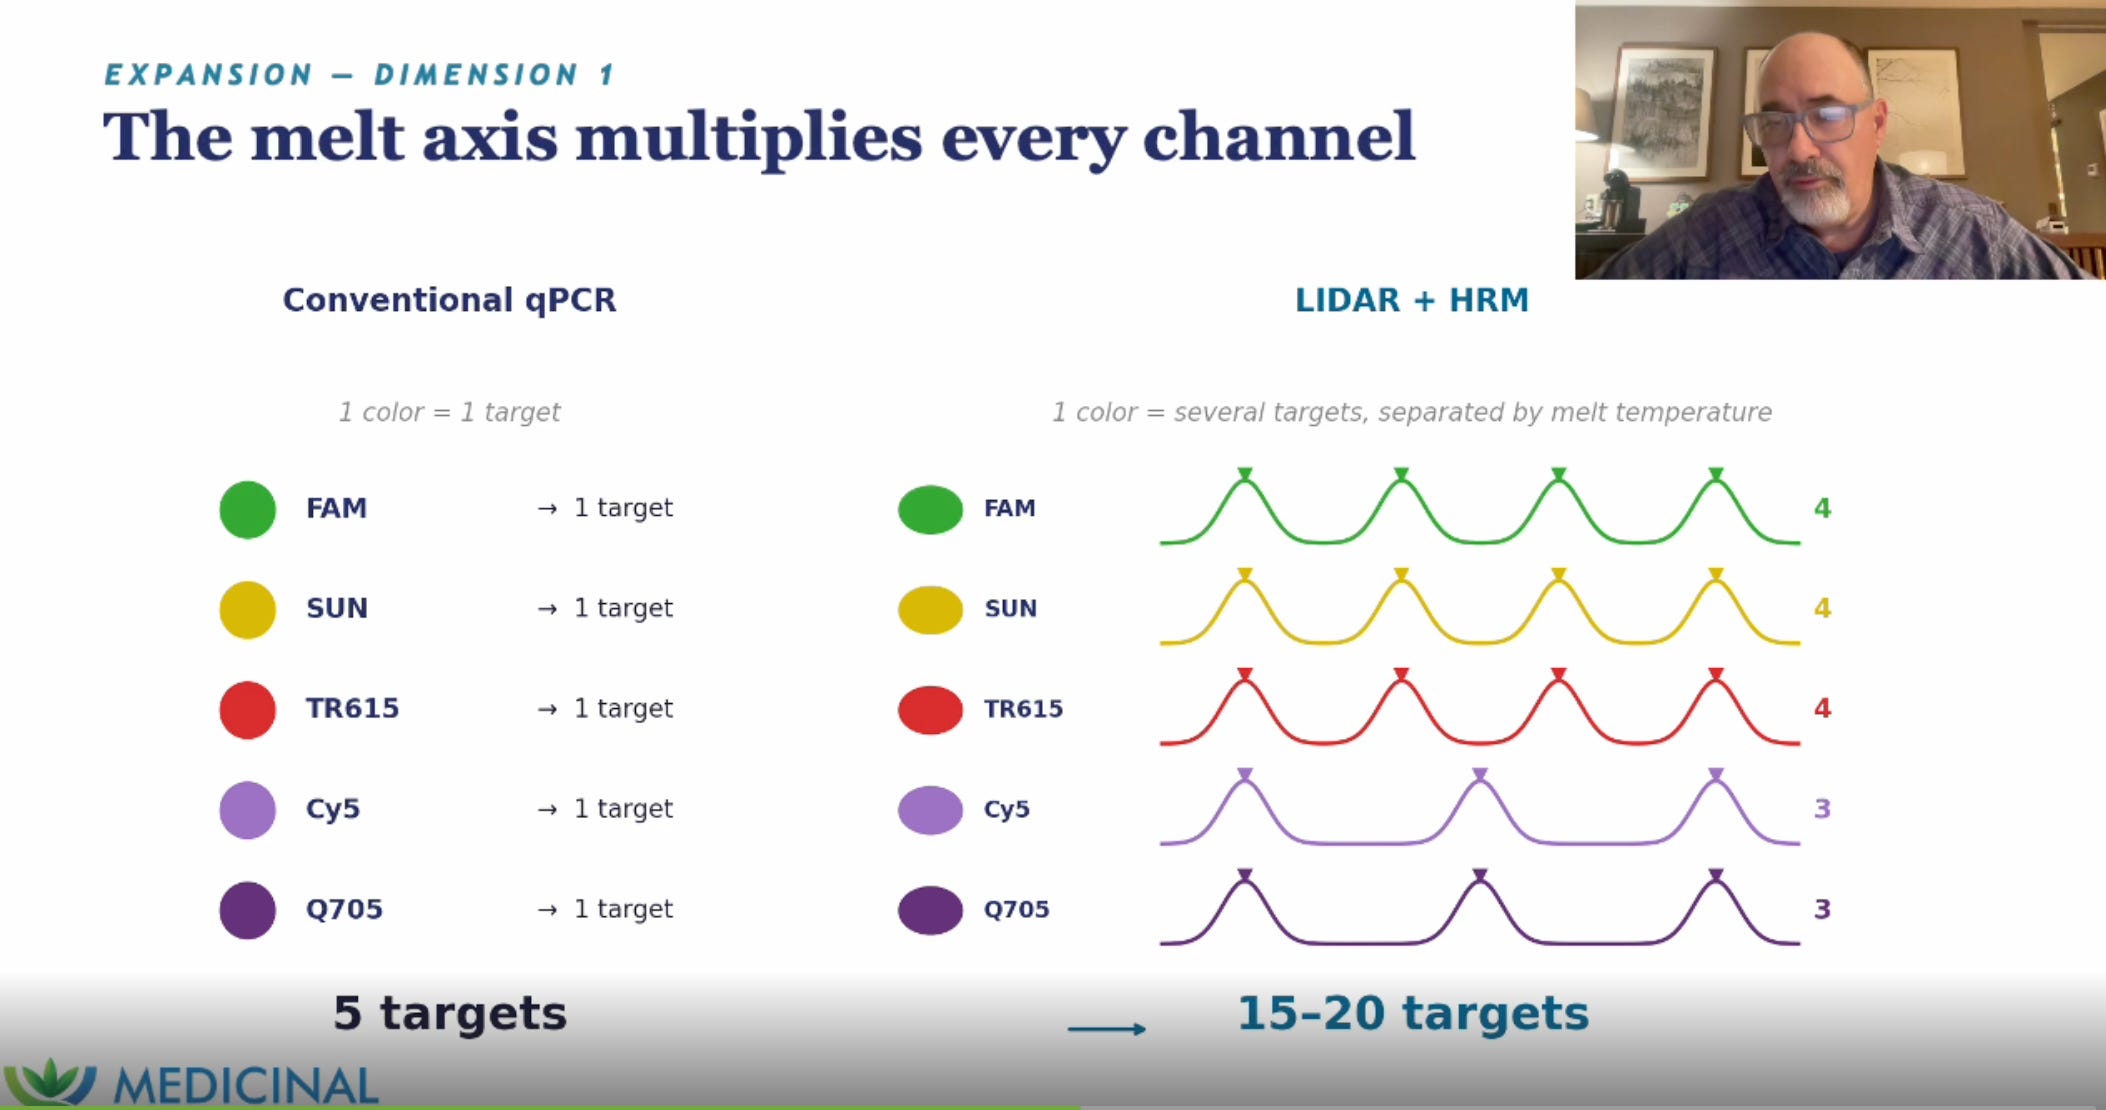
This gets into the combinatorics of using one or more colors to label a target. A simple deployment would assign 3-4 targets in each color where each target has unique HRMs. This enables 15-20X multiplexing.
But once you have orthogonally dequenched reporters (as you do when you combine LIDAR with Taqman), you can solve a long standing problem in the qPCR space known as the unordered pair problem.
Briefly, with Taqman alone, you cannot use expanded color combinations to encode more targets. What do I mean by that?
There has always been the temptation to use pairs of colors to encode targets. With 5 (N) colors you have (5X5)-N different 2 color combinations or N^2-N if you omit identical color combinations like Blue-Blue, Green-Green, Yellow-Yellow, Red-Red, and Orange-Orange. People omit the same color combinations as you get one signal from qPCR and you can’t discern Just Blue from Blue-Blue.
These color combinations have historically gone under-utilized as Taqman also fails to discern Yellow-Green targets from targets labeled Green-Yellow. It cannot order these pairs of colors so targets labeled Yellow-Green look the same as their reverse ordered Green-Yellow pair.
Once you have a signal that dequenches differently, you can order this unordered pair problem.
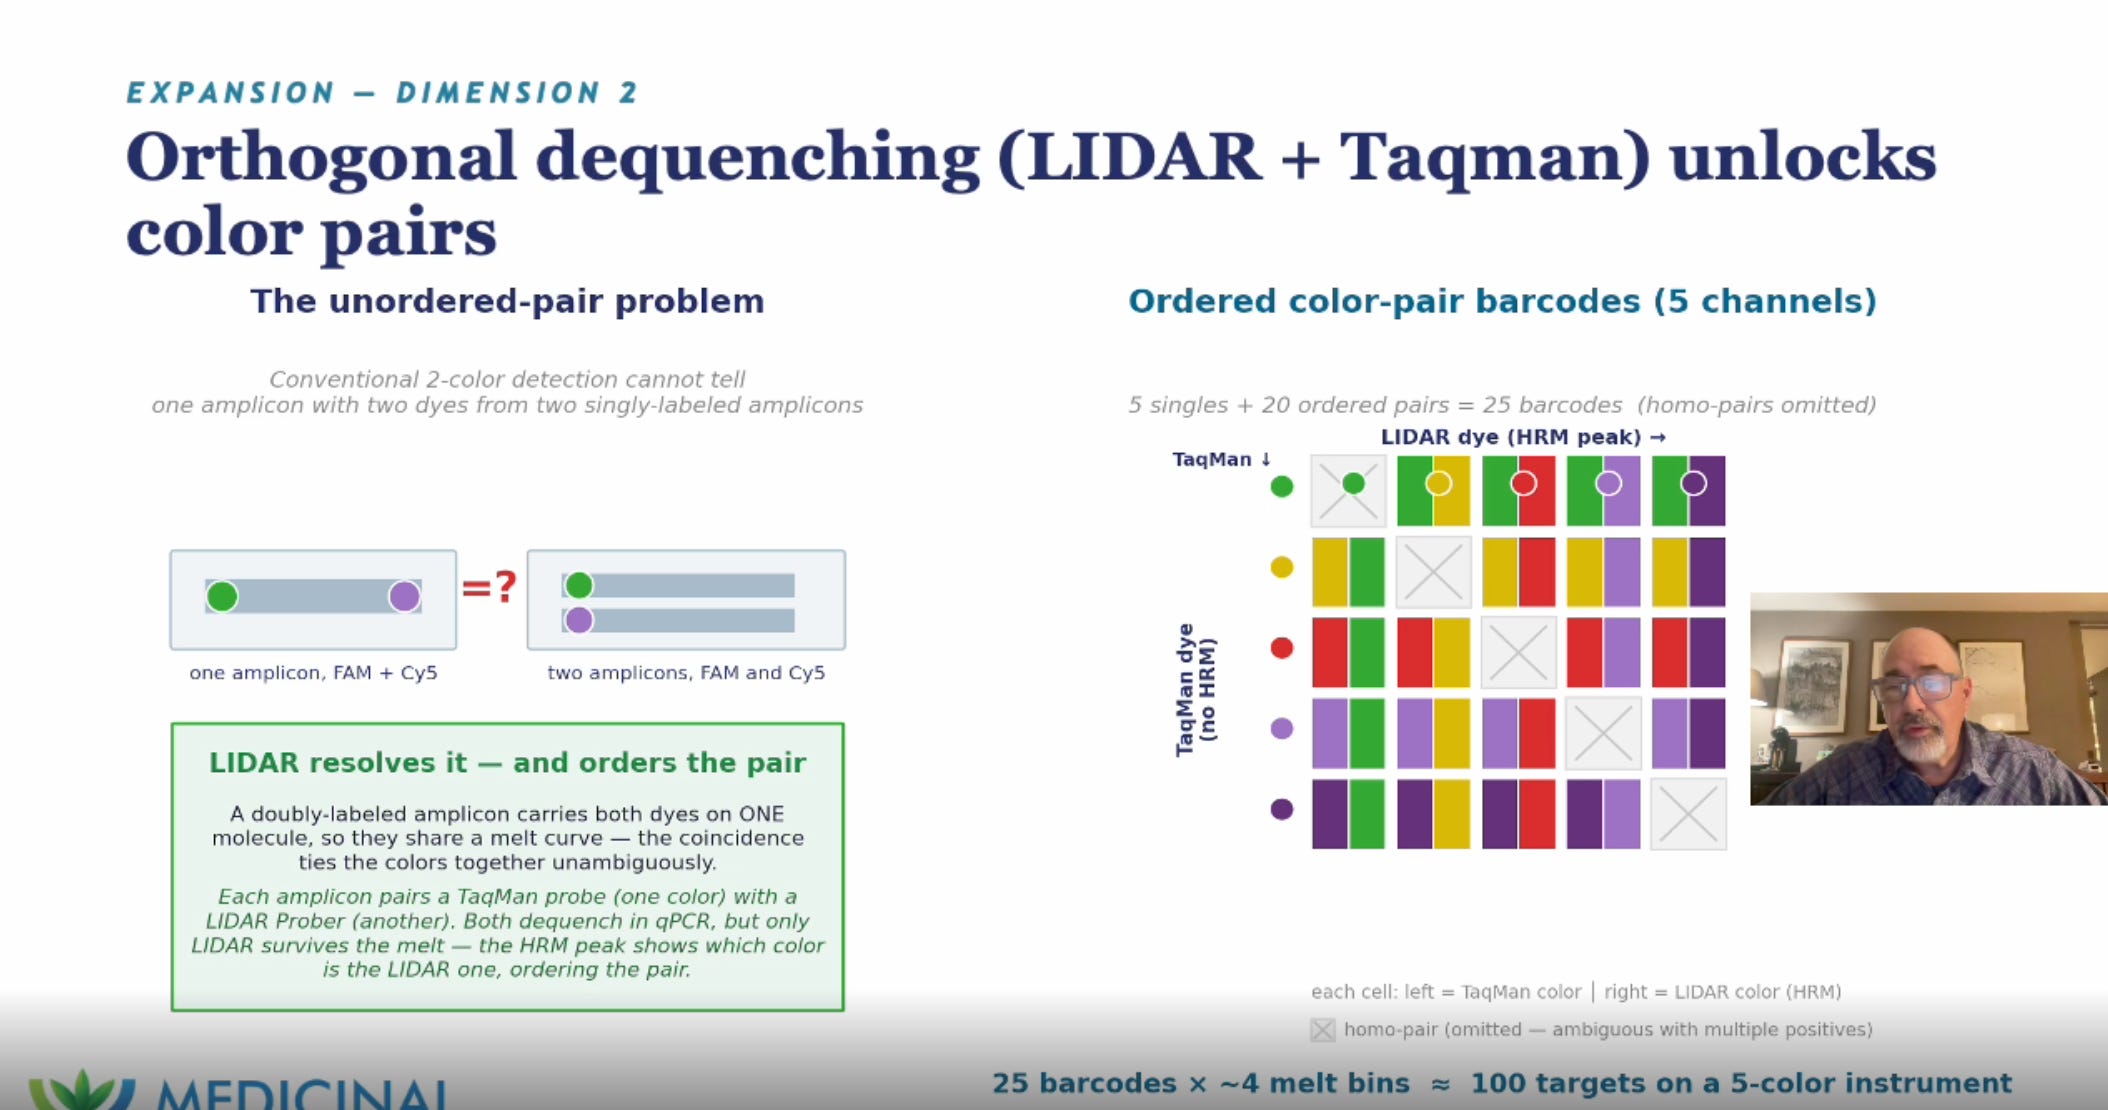
Note the color chart on the right. One set of colors is Taqman detected on the Y axis and another set is LIDAR detected in the X dimension. Only the LIDAR signal shows up in HRM.
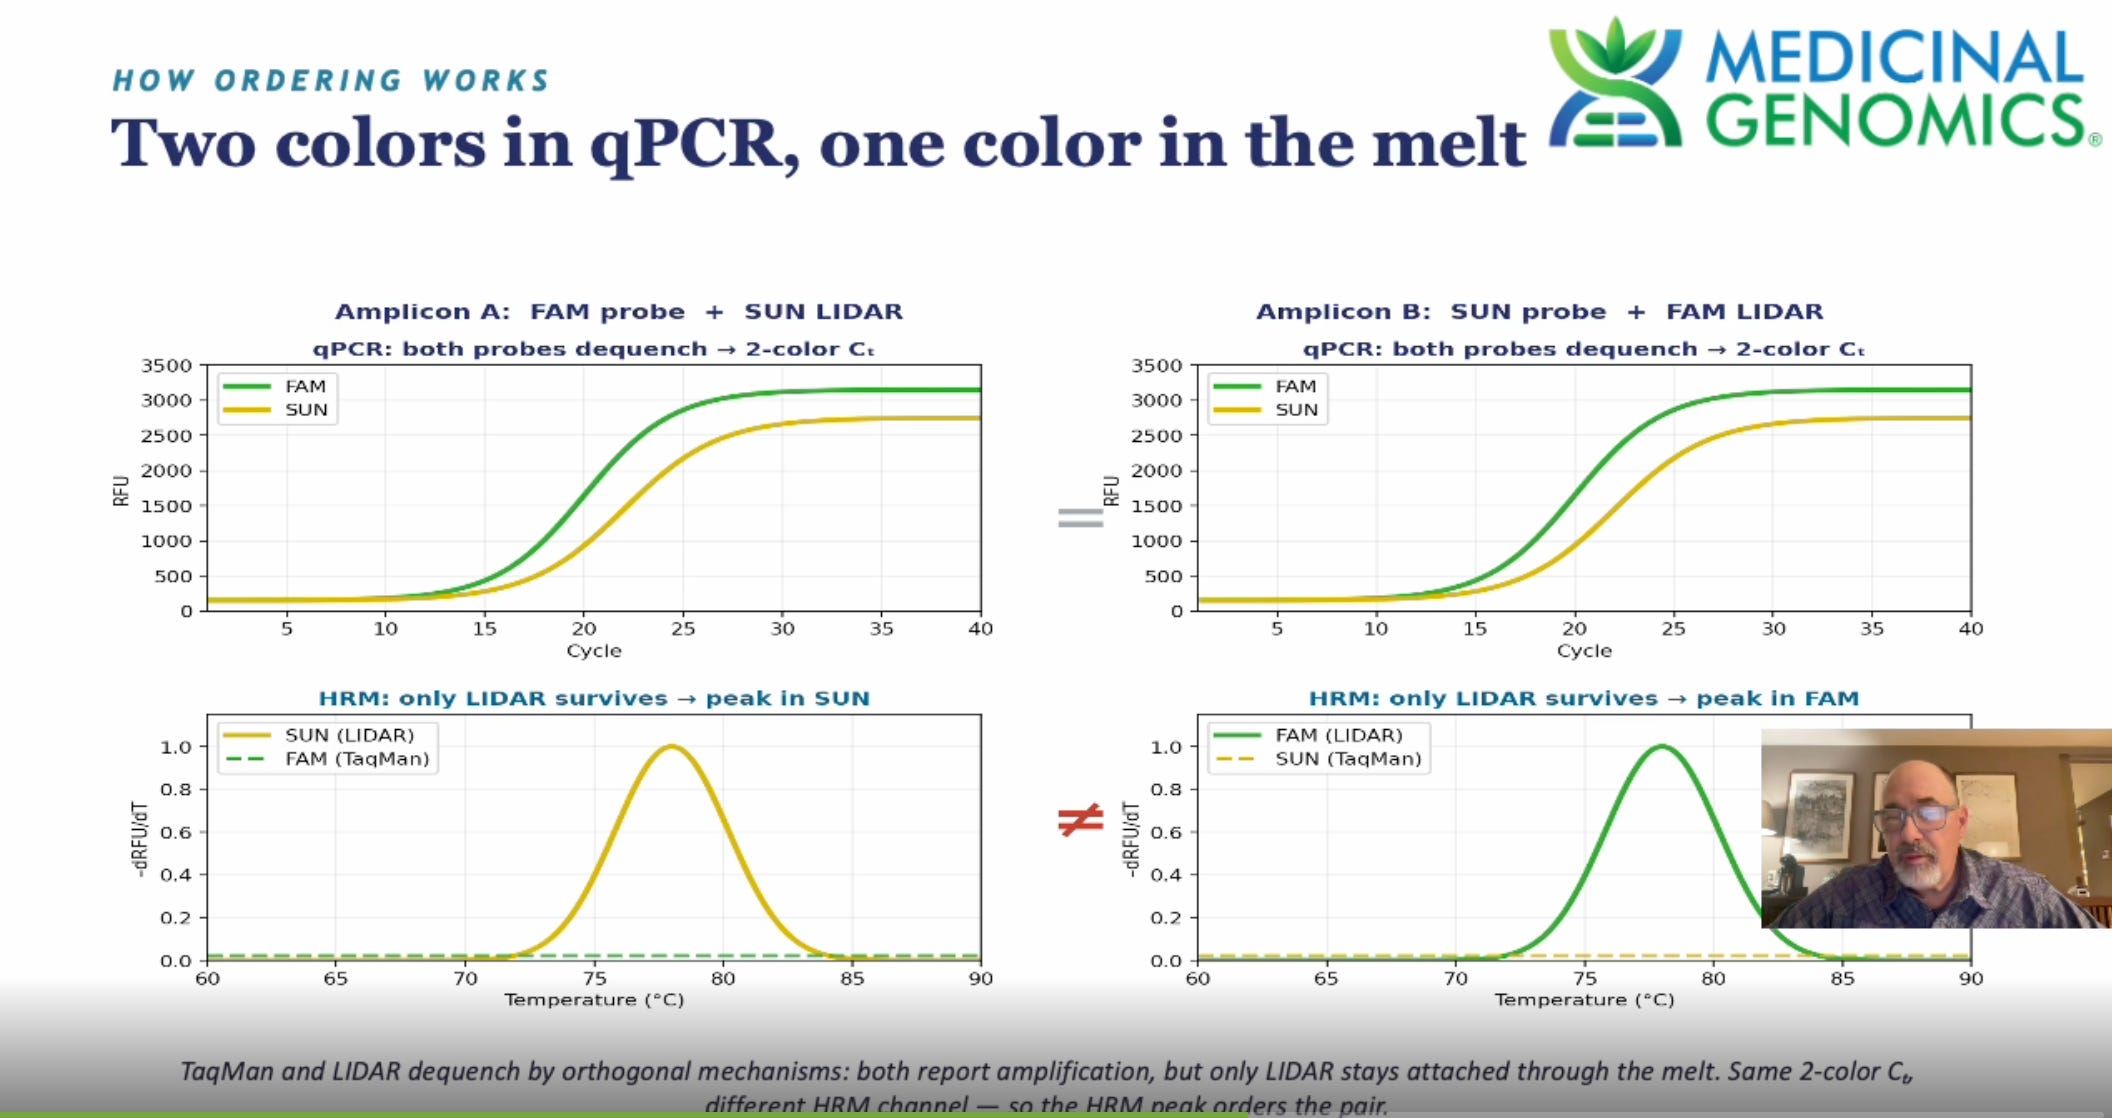
So the differential dequenching of Taqman vs LIDAR can be used to solve the unordered pair problem by observing which signal shows up in HRM and which signal disappears. Now the Yellow-Green target has a unique signature compared to the Green-Yellow target and your color spectrum has expanded from 5 colors to 20 dual colors.
Combine this with targets that occupy different (3-4) HRM zones and you can get 20 targets to expand to 60-80 targets.
But there is still another dimension left under utilized. Signal amplitude is often used to plex different targets in the same color. Use half as much same color probe for one target and the amplitude ‘should be identifiable’ as a different target. We are not great fans of this type of multiplexing as various things can inhibit Taqman to blur those amplitude lines and as I mentioned earlier, Taqman is a 2nd order signal.
However, if one were planning on using the amplitude domain to multiplex, you’d be far less error prone doing so if your readout was not 3 steps removed from priming. Since LIDAR probers measure the 1st step in PCR amplification and not (primer extension) x (probe hyb efficiency) x (FEN1 activity) like Taqman, signal amplitude measurements are more direct and can be done on both forward and reverse primers with different dyes to confirm results.
Below is an example of such a concept. In this case we performed asymmetric PCR where one Forward primer is 10X lower in concentration than its Reverse.
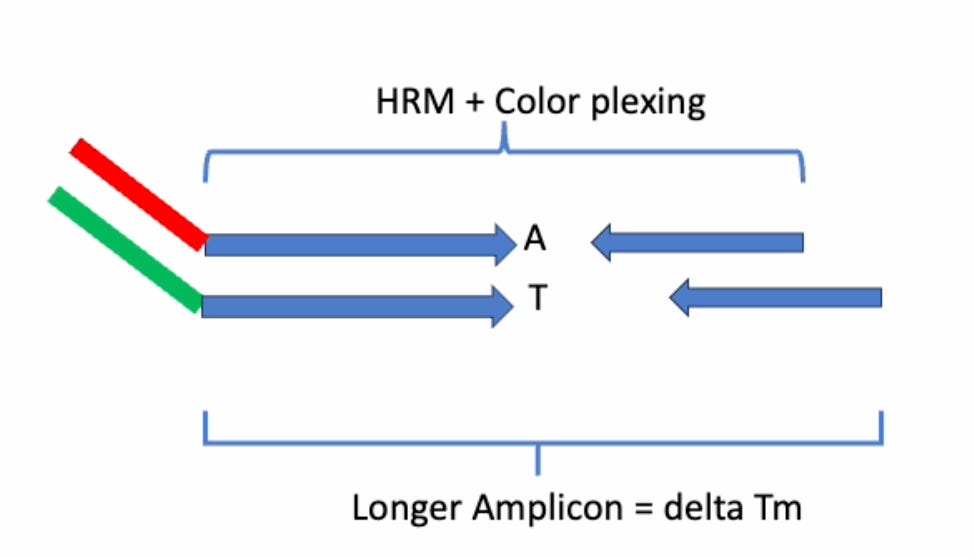
We have 3 different targets all being amplified with a universal LIDAR tail. This is an important distinction as the most expensive part of Taqman is using species specific dual labeled (F-Q) probes. With LIDAR you can make these M13 tails so you make 1 universal prober for all assays and rely on a naked (unlabeled) tailed primer to create the bridge to the universal reporter. After 1-2 cycle of PCR, your E.coli specific amplicon now has your LIDAR tail incorporated and LIDAR can begin the labelling with a universal LIDAR prober. This dramatically reduces probe synthesis costs as all targets can be addressed with 5-10 perfectly engineered reporters (5 diff colored Forward Probers and 5 differently colored reverse probers) and all you have to do to address new organisms is change the bridge/tail primer that unites your target to a reporter sequence. Below, the Blue regions of the primer are Organisms specific. The Red and Green sequences are universal LIDAR prober sequences.
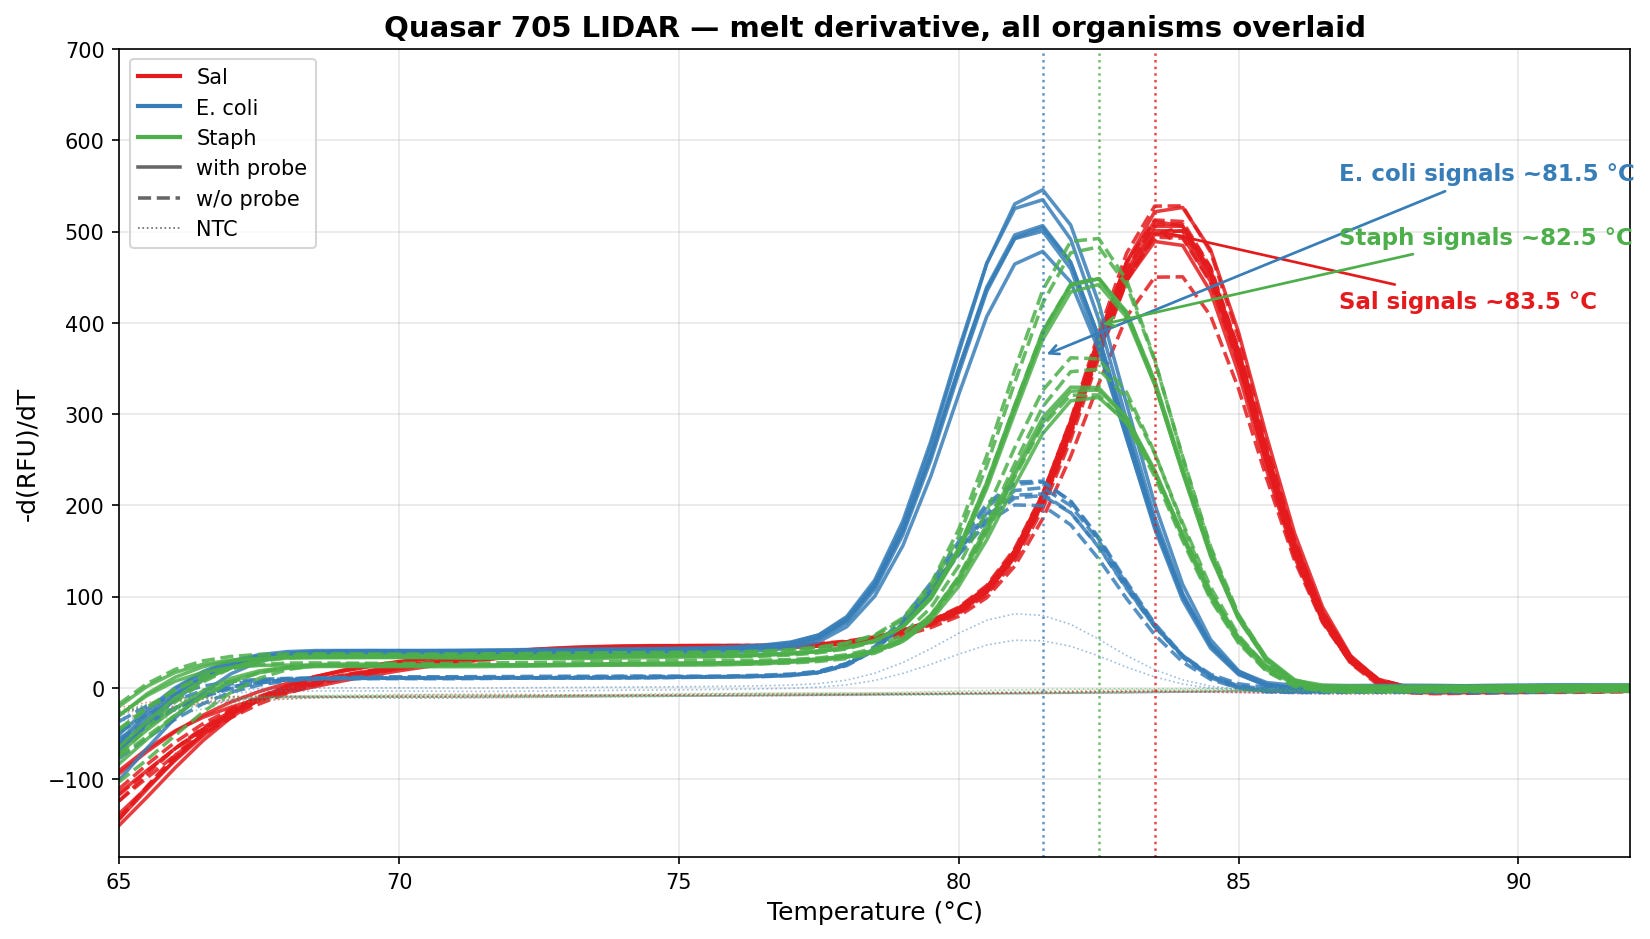
Using this tailed approach, we have E.coli, Staph and Salmonella bridge primers all amplifying with Quasar705. We have Pseudo-color coded the HRMs to show they are all distinguishable with unique HRM temps. You will also notice Blue and Green peaks that are half the amplitude of their other respective colors.
These are wells where the primer concentrations for the Forward strand were 10X lower than the Reverse strand so asymmetric PCR occurred and generated more Reverse strand than forward strand thus making the HRM amplitudes lower.
You’ll note the chart has “with and without probe” labeled. We used Taqman probes designed to hit different strands to confirm the Asymmetric PCR but these don’t show up in HRM. This could also be done with Dual LIDAR detection and is demonstrated in my CannMed 2026 talk.
In conclusion, we have reengineered qPCR to give us the best of both worlds. SYBR Green like HRMs with 5 colors + Forward and Reverse melting temperature dimensionality, while also reducing the DNA footprint required for amplifying small DNAs as seen in miRNA, Circulating Tumor DNA, vaccine QC, and ancient DNA applications. We have also removed the greatest cost barrier to Taqman (probe synthesis) by engineering universal tails for qPCR that give a more direct measurement of the kinetics of the amplification.
LIDAR used in combination with Taqman, greatly expands the color dimensionality by solving the unordered pair problem. This significantly expands the information content delivered from a qPCR reaction such that single target PCR becomes reckless corner cutting.
This added multiplex capability doesn’t need to trade off accuracy for speed. One can use these expanded codes to include more internal controls, more matrix controls and more amplicons per organisms to protect against PCR generated pseudo-epidemics. This can also be used to increase the number of targets one amplifies to assess DNaseI fragmented libraries while retaining quantitation of small DNAs.
These data demonstrate that amplicon size can alter DNA quantitation by 4-5 CTs and introduce a 16-32 fold variance in DNaseI treated vaccines. Because amplicon-size bias and region-specific digestion are independent effects — the former an intrinsic property of the detection chemistry, the latter a property of the template — they act orthogonally and compound rather than overlap. Combining this size effect with the ~6 CT differential digestion of Ori versus Spike regions reported by McKernan et al. , Speicher et al., and Fleming et al. therefore implies a combined variance approaching 10 CT (~1000-fold) between large amplicons targeting Ori and short amplicons targeting Spike.
Thus having the qPCR methods used by the regulators deemed as proprietary is simply a refusal to have any transparency or assurances of the actual metric in question. Claiming something is below 10ng/dose may be from a combinations of failing to look in spike where the DNaseI is 100 fold less active or using large amplicons that simply fail to PCR the majority of the DNA that is present. The fact that this DNA is small is of no assurance as its LNP protected, has nuclear targeting sequences, mammalian promoters and mammalian origins of replication and somatic hypermutability elements in the SV40 Enhancer. Its important to emphasize that the both Pfizer and Moderna vaccines have ColE1 oris. These are published to be mammalian cryptic promoters that can express genes downstream of them. For the regulators to call this DNA non-functional is an egregious error as it contains all the material required to express spike protein in mammalian cells and DNA is known to decay slower than RNA thus giving credence to this contaminant being the primary cause of persistent spike expression in patients with LongVax. The 10ng/dose does not apply to transfections of such content. Small DNA, once transfected is not benign. It is more prone to integrate as it has a higher molarity of Phosphates and hydroxyls than high molecular weight DNA and its known to trigger the cGAS-STING pathway.
Kwon et al has shown that chronic stimulation of cGAS-STING can lead to oncogenesis (cancer). Recent data from SEER shows an increase of such events since the vaccine program rolled out.